

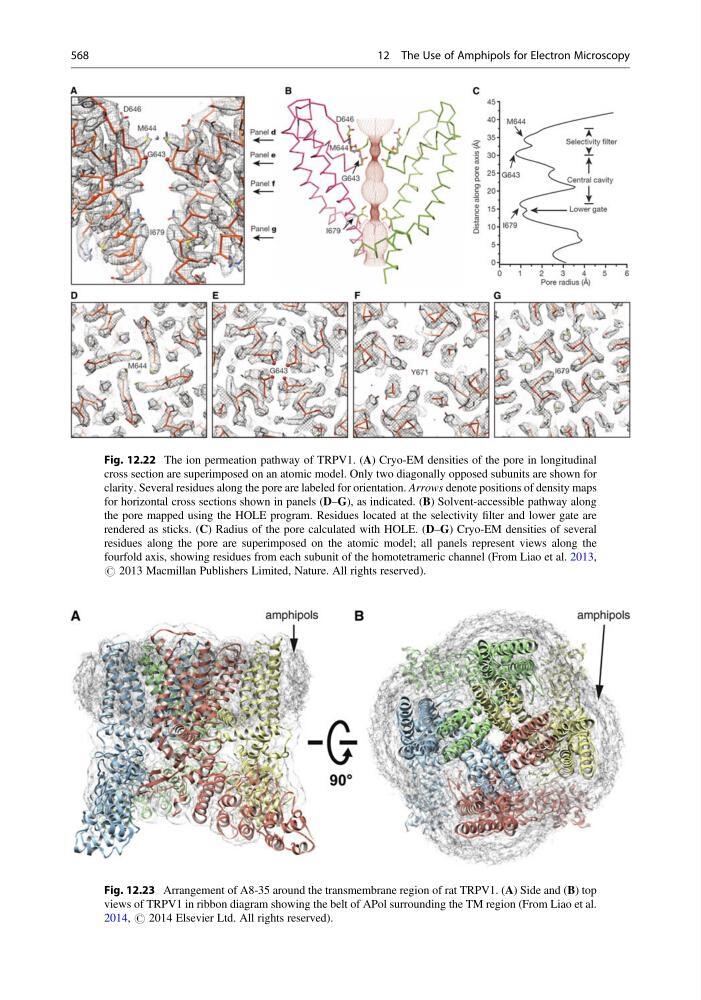
Fig. 12.22 The ion permeation pathway of TRPV1. (A) Cryo-EM densities of the pore in longitudinal
cross section are superimposed on an atomic model. Only two diagonally opposed subunits are shown for
clarity. Several residues along the pore are labeled for orientation. Arrows denote positions of density maps
for horizontal cross sections shown in panels (D–G), as indicated. (B) Solvent-accessible pathway along
the pore mapped using the HOLE program. Residues located at the selectivity filter and lower gate are
rendered as sticks. (C) Radius of the pore calculated with HOLE. (D–G) Cryo-EM densities of several
residues along the pore are superimposed on the atomic model; all panels represent views along the
fourfold axis, showing residues from each subunit of the homotetrameric channel (From Liao et al. 2013,
# 2013 Macmillan Publishers Limited, Nature. All rights reserved).
Fig. 12.23 Arrangement of A8-35 around the transmembrane region of rat TRPV1. (A) Side and (B) top
views of TRPV1 in ribbon diagram showing the belt of APol surrounding the TM region (From Liao et al.
2014, # 2014 Elsevier Ltd. All rights reserved).
568
12 The Use of Amphipols for Electron Microscopy
cross section are superimposed on an atomic model. Only two diagonally opposed subunits are shown for
clarity. Several residues along the pore are labeled for orientation. Arrows denote positions of density maps
for horizontal cross sections shown in panels (D–G), as indicated. (B) Solvent-accessible pathway along
the pore mapped using the HOLE program. Residues located at the selectivity filter and lower gate are
rendered as sticks. (C) Radius of the pore calculated with HOLE. (D–G) Cryo-EM densities of several
residues along the pore are superimposed on the atomic model; all panels represent views along the
fourfold axis, showing residues from each subunit of the homotetrameric channel (From Liao et al. 2013,
# 2013 Macmillan Publishers Limited, Nature. All rights reserved).
Fig. 12.23 Arrangement of A8-35 around the transmembrane region of rat TRPV1. (A) Side and (B) top
views of TRPV1 in ribbon diagram showing the belt of APol surrounding the TM region (From Liao et al.
2014, # 2014 Elsevier Ltd. All rights reserved).
568
12 The Use of Amphipols for Electron Microscopy