

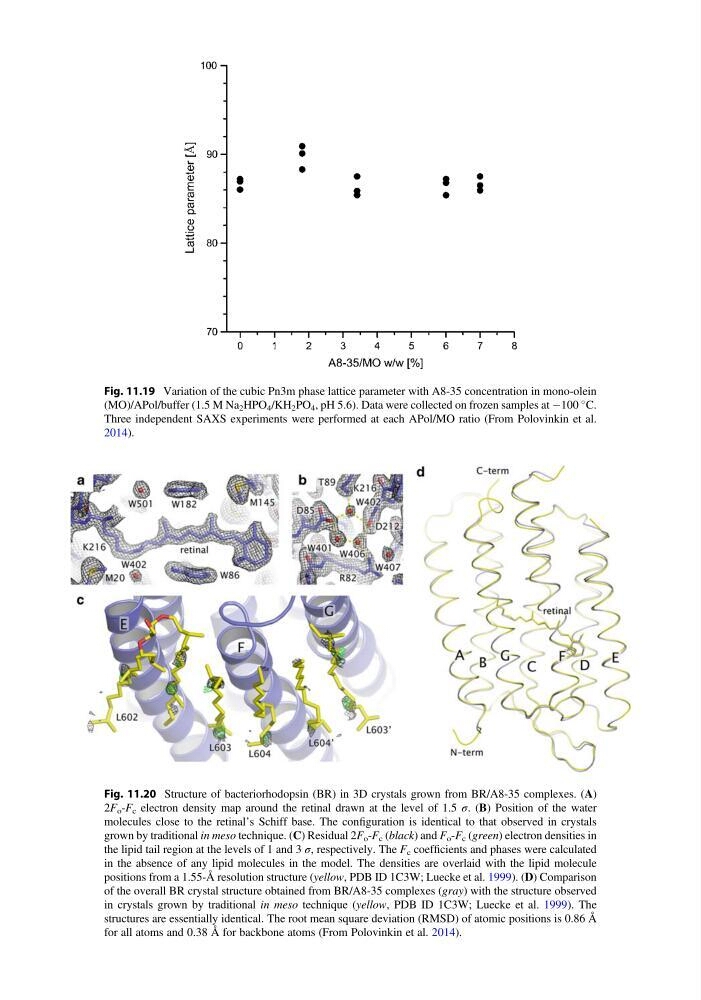
Fig. 11.19 Variation of the cubic Pn3m phase lattice parameter with A8-35 concentration in mono-olein
(MO)/APol/buffer (1.5 M Na 2 HPO 4 /KH 2 PO 4 , pH 5.6). Data were collected on frozen samples at À100
C.
Three independent SAXS experiments were performed at each APol/MO ratio (From Polovinkin et al.
2014).
Fig. 11.20 Structure of bacteriorhodopsin (BR) in 3D crystals grown from BR/A8-35 complexes. (A)
2F o -F c electron density map around the retinal drawn at the level of 1.5 σ. (B) Position of the water
molecules close to the retinal’s Schiff base. The configuration is identical to that observed in crystals
grown by traditional in meso technique. (C) Residual 2F o -F c (black) and F o -F c (green) electron densities in
the lipid tail region at the levels of 1 and 3 σ, respectively. The F c coefficients and phases were calculated
in the absence of any lipid molecules in the model. The densities are overlaid with the lipid molecule
positions from a 1.55-Å resolution structure (yellow, PDB ID 1C3W; Luecke et al. 1999). (D) Comparison
of the overall BR crystal structure obtained from BR/A8-35 complexes (gray) with the structure observed
in crystals grown by traditional in meso technique (yellow, PDB ID 1C3W; Luecke et al. 1999). The
structures are essentially identical. The root mean square deviation (RMSD) of atomic positions is 0.86 Å
for all atoms and 0.38 Å for backbone atoms (From Polovinkin et al. 2014).
(MO)/APol/buffer (1.5 M Na 2 HPO 4 /KH 2 PO 4 , pH 5.6). Data were collected on frozen samples at À100
C.
Three independent SAXS experiments were performed at each APol/MO ratio (From Polovinkin et al.
2014).
Fig. 11.20 Structure of bacteriorhodopsin (BR) in 3D crystals grown from BR/A8-35 complexes. (A)
2F o -F c electron density map around the retinal drawn at the level of 1.5 σ. (B) Position of the water
molecules close to the retinal’s Schiff base. The configuration is identical to that observed in crystals
grown by traditional in meso technique. (C) Residual 2F o -F c (black) and F o -F c (green) electron densities in
the lipid tail region at the levels of 1 and 3 σ, respectively. The F c coefficients and phases were calculated
in the absence of any lipid molecules in the model. The densities are overlaid with the lipid molecule
positions from a 1.55-Å resolution structure (yellow, PDB ID 1C3W; Luecke et al. 1999). (D) Comparison
of the overall BR crystal structure obtained from BR/A8-35 complexes (gray) with the structure observed
in crystals grown by traditional in meso technique (yellow, PDB ID 1C3W; Luecke et al. 1999). The
structures are essentially identical. The root mean square deviation (RMSD) of atomic positions is 0.86 Å
for all atoms and 0.38 Å for backbone atoms (From Polovinkin et al. 2014).