

expected to vary depending on the tendency of the protein to self-associate, as well as on the nature of
the APol and buffer conditions.
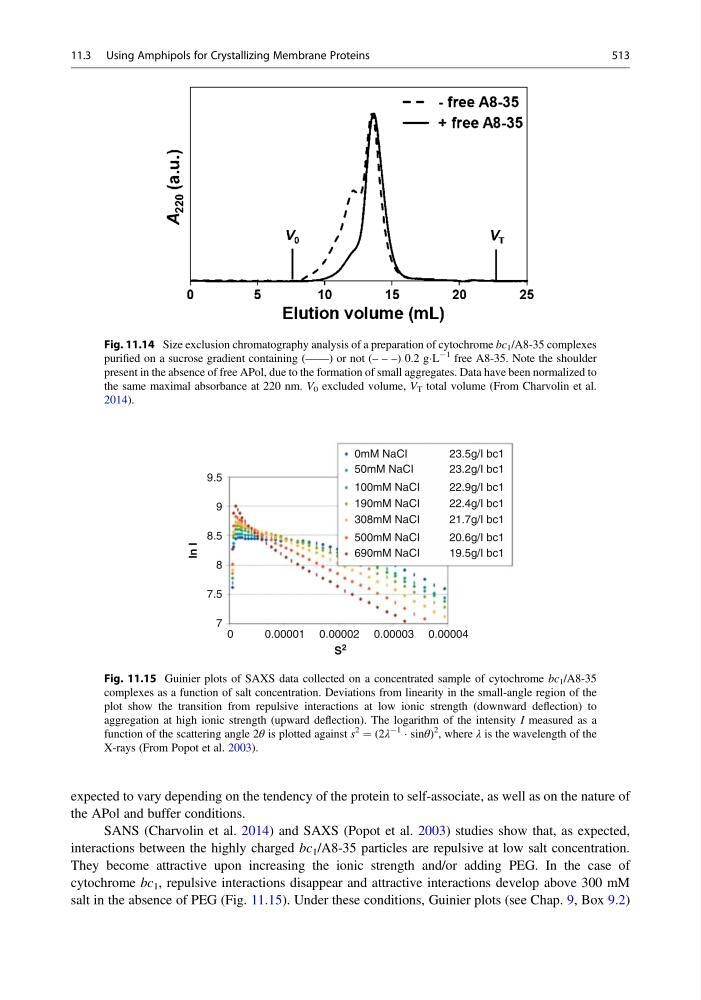
SANS (Charvolin et al. 2014) and SAXS (Popot et al. 2003) studies show that, as expected,
interactions between the highly charged bc 1 /A8-35 particles are repulsive at low salt concentration.
They become attractive upon increasing the ionic strength and/or adding PEG. In the case of
cytochrome bc 1 , repulsive interactions disappear and attractive interactions develop above 300 mM
salt in the absence of PEG (Fig. 11.15). Under these conditions, Guinier plots (see Chap. 9, Box 9.2)
Fig. 11.14 Size exclusion chromatography analysis of a preparation of cytochrome bc 1 /A8-35 complexes
purified on a sucrose gradient containing (——) or not (– – –) 0.2 gÁL
À1 free A8-35. Note the shoulder
present in the absence of free APol, due to the formation of small aggregates. Data have been normalized to
the same maximal absorbance at 220 nm. V 0 excluded volume, V T total volume (From Charvolin et al.
2014).
7
0
0.00001
0.00003
0mM NaCI
50mM NaCI
100mM NaCI
190mM NaCI
308mM NaCI
500mM NaCI
690mM NaCI
23.5g/I bc1
23.2g/I bc1
22.9g/I bc1
22.4g/I bc1
21.7g/I bc1
20.6g/I bc1
19.5g/I bc1
0.00004
0.00002
S
2
In I
7.5
8
8.5
9
9.5
Fig. 11.15 Guinier plots of SAXS data collected on a concentrated sample of cytochrome bc 1 /A8-35
complexes as a function of salt concentration. Deviations from linearity in the small-angle region of the
plot show the transition from repulsive interactions at low ionic strength (downward deflection) to
aggregation at high ionic strength (upward deflection). The logarithm of the intensity I measured as a
function of the scattering angle 2θ is plotted against s
2 ¼ (2λ
À1 Á sinθ)
2
, where λ is the wavelength of the
X-rays (From Popot et al. 2003).
11.3 Using Amphipols for Crystallizing Membrane Proteins
513
the APol and buffer conditions.
SANS (Charvolin et al. 2014) and SAXS (Popot et al. 2003) studies show that, as expected,
interactions between the highly charged bc 1 /A8-35 particles are repulsive at low salt concentration.
They become attractive upon increasing the ionic strength and/or adding PEG. In the case of
cytochrome bc 1 , repulsive interactions disappear and attractive interactions develop above 300 mM
salt in the absence of PEG (Fig. 11.15). Under these conditions, Guinier plots (see Chap. 9, Box 9.2)
Fig. 11.14 Size exclusion chromatography analysis of a preparation of cytochrome bc 1 /A8-35 complexes
purified on a sucrose gradient containing (——) or not (– – –) 0.2 gÁL
À1 free A8-35. Note the shoulder
present in the absence of free APol, due to the formation of small aggregates. Data have been normalized to
the same maximal absorbance at 220 nm. V 0 excluded volume, V T total volume (From Charvolin et al.
2014).
7
0
0.00001
0.00003
0mM NaCI
50mM NaCI
100mM NaCI
190mM NaCI
308mM NaCI
500mM NaCI
690mM NaCI
23.5g/I bc1
23.2g/I bc1
22.9g/I bc1
22.4g/I bc1
21.7g/I bc1
20.6g/I bc1
19.5g/I bc1
0.00004
0.00002
S
2
In I
7.5
8
8.5
9
9.5
Fig. 11.15 Guinier plots of SAXS data collected on a concentrated sample of cytochrome bc 1 /A8-35
complexes as a function of salt concentration. Deviations from linearity in the small-angle region of the
plot show the transition from repulsive interactions at low ionic strength (downward deflection) to
aggregation at high ionic strength (upward deflection). The logarithm of the intensity I measured as a
function of the scattering angle 2θ is plotted against s
2 ¼ (2λ
À1 Á sinθ)
2
, where λ is the wavelength of the
X-rays (From Popot et al. 2003).
11.3 Using Amphipols for Crystallizing Membrane Proteins
513