

contributions of LTB 4 specifically bound to its physiological site from those of ligand molecules free in
the aqueous solution, dissolved in BLT2-bound and free DAPol, or non-specifically bound to the
protein, the study required numerous controls, including the use of a BLT2 mutant that does not
specifically bind LTB 4 .
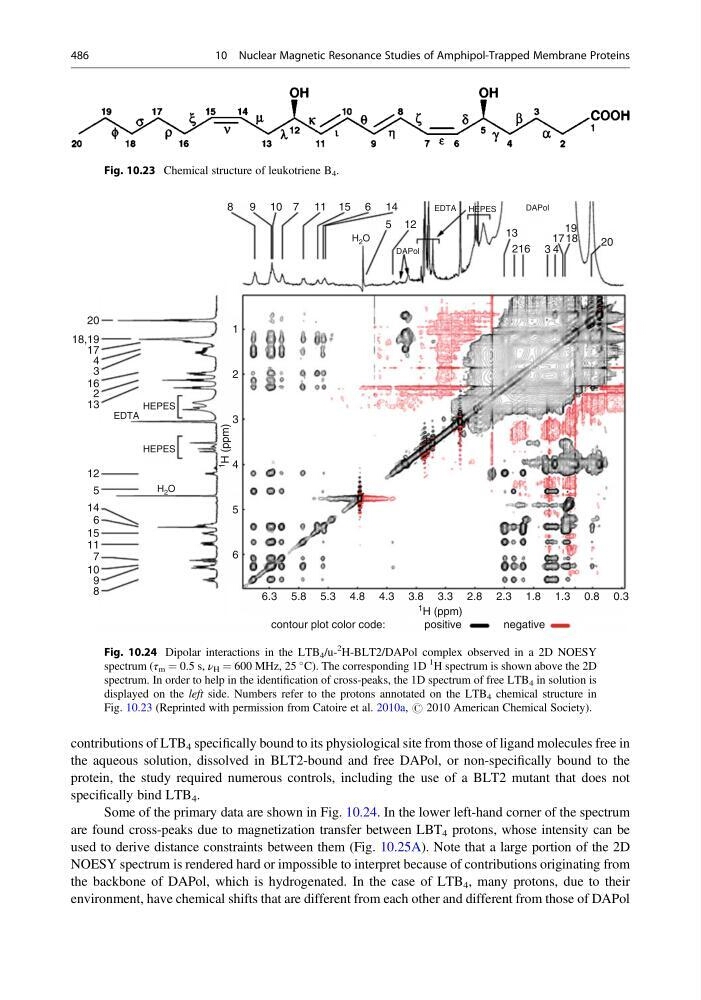
Some of the primary data are shown in Fig. 10.24. In the lower left-hand corner of the spectrum
are found cross-peaks due to magnetization transfer between LBT 4 protons, whose intensity can be
used to derive distance constraints between them (Fig. 10.25A). Note that a large portion of the 2D
NOESY spectrum is rendered hard or impossible to interpret because of contributions originating from
the backbone of DAPol, which is hydrogenated. In the case of LTB 4 , many protons, due to their
environment, have chemical shifts that are different from each other and different from those of DAPol
Fig. 10.23 Chemical structure of leukotriene B 4 .
6.3
6
8
9
10
7
11
15
6
14
5
12
13
2
16
3
4
17
18,19
20
EDTA
EDTA
HEPES
HEPES
DAPol
DAPol
8 9 10 7 11 15 6 14
5 12
13
216 3 4
17 18
19
20
H 2 O
H 2 O
HEPES
5
4
1
H (ppm)
1 H (ppm)
3
2
1
5.8 5.3 4.8 4.3 3.8 3.3 2.8 2.3 1.8
negative
positive
contour plot color code:
1.3 0.8 0.3
Fig. 10.24 Dipolar interactions in the LTB 4 /u2
H-BLT2/DAPol complex observed in a 2D NOESY
spectrum (τ m ¼ 0.5 s, ν H ¼ 600 MHz, 25
C). The corresponding 1D
1
H spectrum is shown above the 2D
spectrum. In order to help in the identification of cross-peaks, the 1D spectrum of free LTB 4 in solution is
displayed on the left side. Numbers refer to the protons annotated on the LTB 4 chemical structure in
Fig. 10.23 (Reprinted with permission from Catoire et al. 2010a, # 2010 American Chemical Society).
486
10 Nuclear Magnetic Resonance Studies of Amphipol-Trapped Membrane Proteins
the aqueous solution, dissolved in BLT2-bound and free DAPol, or non-specifically bound to the
protein, the study required numerous controls, including the use of a BLT2 mutant that does not
specifically bind LTB 4 .
Some of the primary data are shown in Fig. 10.24. In the lower left-hand corner of the spectrum
are found cross-peaks due to magnetization transfer between LBT 4 protons, whose intensity can be
used to derive distance constraints between them (Fig. 10.25A). Note that a large portion of the 2D
NOESY spectrum is rendered hard or impossible to interpret because of contributions originating from
the backbone of DAPol, which is hydrogenated. In the case of LTB 4 , many protons, due to their
environment, have chemical shifts that are different from each other and different from those of DAPol
Fig. 10.23 Chemical structure of leukotriene B 4 .
6.3
6
8
9
10
7
11
15
6
14
5
12
13
2
16
3
4
17
18,19
20
EDTA
EDTA
HEPES
HEPES
DAPol
DAPol
8 9 10 7 11 15 6 14
5 12
13
216 3 4
17 18
19
20
H 2 O
H 2 O
HEPES
5
4
1
H (ppm)
1 H (ppm)
3
2
1
5.8 5.3 4.8 4.3 3.8 3.3 2.8 2.3 1.8
negative
positive
contour plot color code:
1.3 0.8 0.3
Fig. 10.24 Dipolar interactions in the LTB 4 /u2
H-BLT2/DAPol complex observed in a 2D NOESY
spectrum (τ m ¼ 0.5 s, ν H ¼ 600 MHz, 25
C). The corresponding 1D
1
H spectrum is shown above the 2D
spectrum. In order to help in the identification of cross-peaks, the 1D spectrum of free LTB 4 in solution is
displayed on the left side. Numbers refer to the protons annotated on the LTB 4 chemical structure in
Fig. 10.23 (Reprinted with permission from Catoire et al. 2010a, # 2010 American Chemical Society).
486
10 Nuclear Magnetic Resonance Studies of Amphipol-Trapped Membrane Proteins