

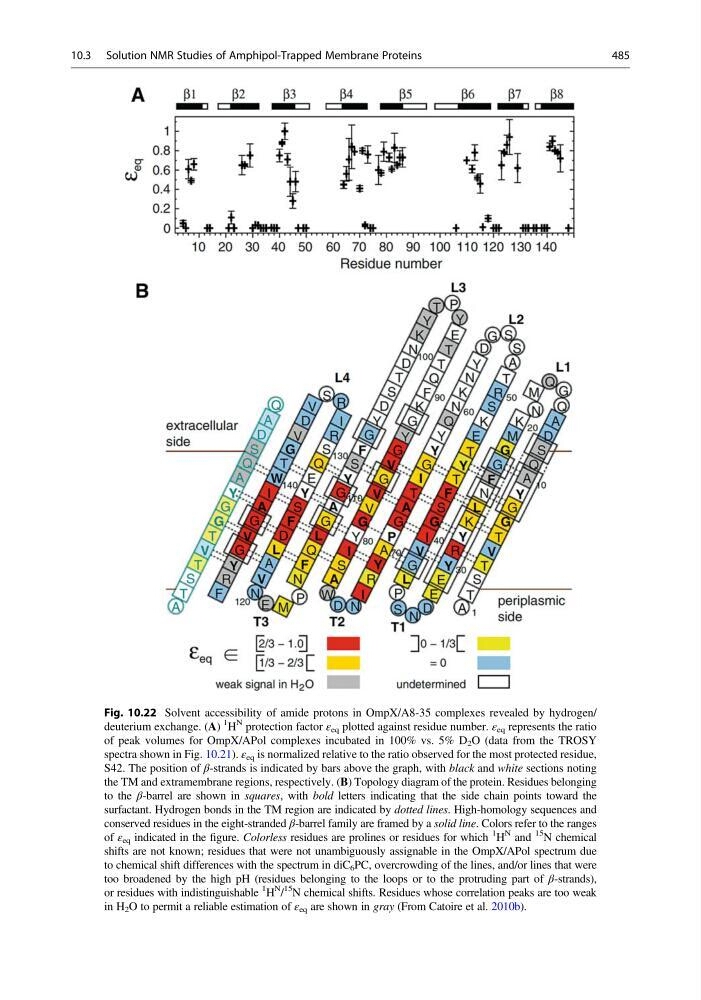
Fig. 10.22 Solvent accessibility of amide protons in OmpX/A8-35 complexes revealed by hydrogen/
deuterium exchange. (A)
1
H
N protection factor ε eq plotted against residue number. ε eq represents the ratio
of peak volumes for OmpX/APol complexes incubated in 100% vs. 5% D 2 O (data from the TROSY
spectra shown in Fig. 10.21). ε eq is normalized relative to the ratio observed for the most protected residue,
S42. The position of β-strands is indicated by bars above the graph, with black and white sections noting
the TM and extramembrane regions, respectively. (B) Topology diagram of the protein. Residues belonging
to the β-barrel are shown in squares, with bold letters indicating that the side chain points toward the
surfactant. Hydrogen bonds in the TM region are indicated by dotted lines. High-homology sequences and
conserved residues in the eight-stranded β-barrel family are framed by a solid line. Colors refer to the ranges
of ε eq indicated in the figure. Colorless residues are prolines or residues for which
1
H
N and
15
N chemical
shifts are not known; residues that were not unambiguously assignable in the OmpX/APol spectrum due
to chemical shift differences with the spectrum in diC 6 PC, overcrowding of the lines, and/or lines that were
too broadened by the high pH (residues belonging to the loops or to the protruding part of β-strands),
or residues with indistinguishable
1
H
N
/
15
N chemical shifts. Residues whose correlation peaks are too weak
in H 2 O to permit a reliable estimation of ε eq are shown in gray (From Catoire et al. 2010b).
10.3 Solution NMR Studies of Amphipol-Trapped Membrane Proteins
485
deuterium exchange. (A)
1
H
N protection factor ε eq plotted against residue number. ε eq represents the ratio
of peak volumes for OmpX/APol complexes incubated in 100% vs. 5% D 2 O (data from the TROSY
spectra shown in Fig. 10.21). ε eq is normalized relative to the ratio observed for the most protected residue,
S42. The position of β-strands is indicated by bars above the graph, with black and white sections noting
the TM and extramembrane regions, respectively. (B) Topology diagram of the protein. Residues belonging
to the β-barrel are shown in squares, with bold letters indicating that the side chain points toward the
surfactant. Hydrogen bonds in the TM region are indicated by dotted lines. High-homology sequences and
conserved residues in the eight-stranded β-barrel family are framed by a solid line. Colors refer to the ranges
of ε eq indicated in the figure. Colorless residues are prolines or residues for which
1
H
N and
15
N chemical
shifts are not known; residues that were not unambiguously assignable in the OmpX/APol spectrum due
to chemical shift differences with the spectrum in diC 6 PC, overcrowding of the lines, and/or lines that were
too broadened by the high pH (residues belonging to the loops or to the protruding part of β-strands),
or residues with indistinguishable
1
H
N
/
15
N chemical shifts. Residues whose correlation peaks are too weak
in H 2 O to permit a reliable estimation of ε eq are shown in gray (From Catoire et al. 2010b).
10.3 Solution NMR Studies of Amphipol-Trapped Membrane Proteins
485