

HOESY spectrum even with natural abundance
13 C level). In the aromatic
13 C chemical shift range
(116–135 ppm), numerous cross-peaks are observed, resulting from contacts between
13 C nuclei of
aromatic rings in the protein and
1 H nuclei in the side chains of the APol. This is consistent with the
structure of OmpX, which features aromatic rings exposed at the TM surface, potentially accessible to
APol alkyl chains. Interestingly, interactions of the protein with A8-35 octyl chains seem to involve
more extensively the last five CH 2 groups than the terminal CH 3 one, nor the first two CH 2 groups
(Catoire et al. 2009), suggesting that the alkyl chain may interact sideways rather than end on with the
TM surface of the protein.
In Study 10.12 (Table 10.3; Planchard et al. 2014), 3D
15 N-edited
1 H1 H HSQC-NOESYTROSY spectra of [u2 H,
13 C,
15 N]KpOmpA/HAPol complexes were exploited to map the contacts
of the various CH 3 and CH 2 groups in octylamine and isopropylamide side chains of the APol with the
surface of the protein (the TM domain of OmpA from K. pneumoniae). The distribution of the two
types of side chains at the surface of KpOmpA is found to largely overlap. Once again, contacts are
observed between the APol and some of the aromatic residues that mark the limits of the TM region.
Study 10.5 (Table 10.1; Etzkorn et al. 2013) presents an interesting comparative study of BR in
complex with either A8-35, DDM, or DMPC-based NDs. TROSY-HSQC NMR spectra recorded at
40
C were found to be marginally better in A8-35 than in DDM, and significantly better than in NDs
(Fig. 10.14), despite a suboptimal dispersity of the BR/A8-35 complexes (presence of small
aggregates; Etzkorn et al. 2013). It was noted that, whereas the TM region of BR adopts the same
structure in all three environments, some loop residues show chemical shift differences, indicating a
different conformation or environment. In particular, in some loop regions, the data collected on
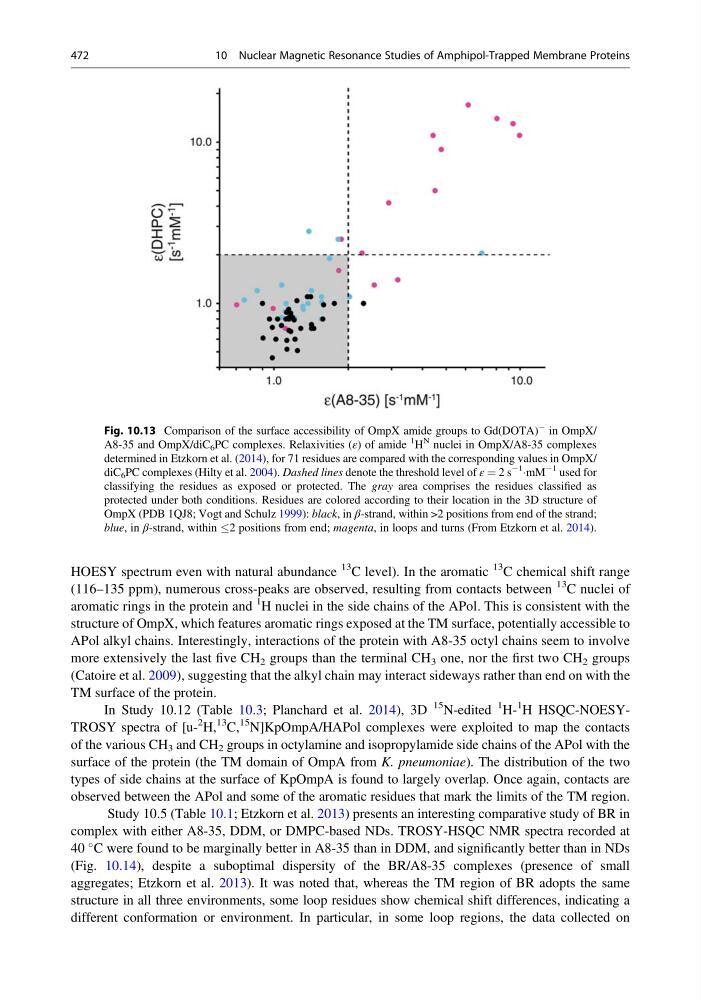
Fig. 10.13 Comparison of the surface accessibility of OmpX amide groups to Gd(DOTA)
À in OmpX/
A8-35 and OmpX/diC 6 PC complexes. Relaxivities (ε) of amide
1
H
N nuclei in OmpX/A8-35 complexes
determined in Etzkorn et al. (2014), for 71 residues are compared with the corresponding values in OmpX/
diC 6 PC complexes (Hilty et al. 2004). Dashed lines denote the threshold level of ε ¼ 2 s
À1
ÁmM
À1 used for
classifying the residues as exposed or protected. The gray area comprises the residues classified as
protected under both conditions. Residues are colored according to their location in the 3D structure of
OmpX (PDB 1QJ8; Vogt and Schulz 1999): black, in β-strand, within >2 positions from end of the strand;
blue, in β-strand, within 2 positions from end; magenta, in loops and turns (From Etzkorn et al. 2014).
472
10 Nuclear Magnetic Resonance Studies of Amphipol-Trapped Membrane Proteins
13 C level). In the aromatic
13 C chemical shift range
(116–135 ppm), numerous cross-peaks are observed, resulting from contacts between
13 C nuclei of
aromatic rings in the protein and
1 H nuclei in the side chains of the APol. This is consistent with the
structure of OmpX, which features aromatic rings exposed at the TM surface, potentially accessible to
APol alkyl chains. Interestingly, interactions of the protein with A8-35 octyl chains seem to involve
more extensively the last five CH 2 groups than the terminal CH 3 one, nor the first two CH 2 groups
(Catoire et al. 2009), suggesting that the alkyl chain may interact sideways rather than end on with the
TM surface of the protein.
In Study 10.12 (Table 10.3; Planchard et al. 2014), 3D
15 N-edited
1 H1 H HSQC-NOESYTROSY spectra of [u2 H,
13 C,
15 N]KpOmpA/HAPol complexes were exploited to map the contacts
of the various CH 3 and CH 2 groups in octylamine and isopropylamide side chains of the APol with the
surface of the protein (the TM domain of OmpA from K. pneumoniae). The distribution of the two
types of side chains at the surface of KpOmpA is found to largely overlap. Once again, contacts are
observed between the APol and some of the aromatic residues that mark the limits of the TM region.
Study 10.5 (Table 10.1; Etzkorn et al. 2013) presents an interesting comparative study of BR in
complex with either A8-35, DDM, or DMPC-based NDs. TROSY-HSQC NMR spectra recorded at
40
C were found to be marginally better in A8-35 than in DDM, and significantly better than in NDs
(Fig. 10.14), despite a suboptimal dispersity of the BR/A8-35 complexes (presence of small
aggregates; Etzkorn et al. 2013). It was noted that, whereas the TM region of BR adopts the same
structure in all three environments, some loop residues show chemical shift differences, indicating a
different conformation or environment. In particular, in some loop regions, the data collected on
Fig. 10.13 Comparison of the surface accessibility of OmpX amide groups to Gd(DOTA)
À in OmpX/
A8-35 and OmpX/diC 6 PC complexes. Relaxivities (ε) of amide
1
H
N nuclei in OmpX/A8-35 complexes
determined in Etzkorn et al. (2014), for 71 residues are compared with the corresponding values in OmpX/
diC 6 PC complexes (Hilty et al. 2004). Dashed lines denote the threshold level of ε ¼ 2 s
À1
ÁmM
À1 used for
classifying the residues as exposed or protected. The gray area comprises the residues classified as
protected under both conditions. Residues are colored according to their location in the 3D structure of
OmpX (PDB 1QJ8; Vogt and Schulz 1999): black, in β-strand, within >2 positions from end of the strand;
blue, in β-strand, within 2 positions from end; magenta, in loops and turns (From Etzkorn et al. 2014).
472
10 Nuclear Magnetic Resonance Studies of Amphipol-Trapped Membrane Proteins