

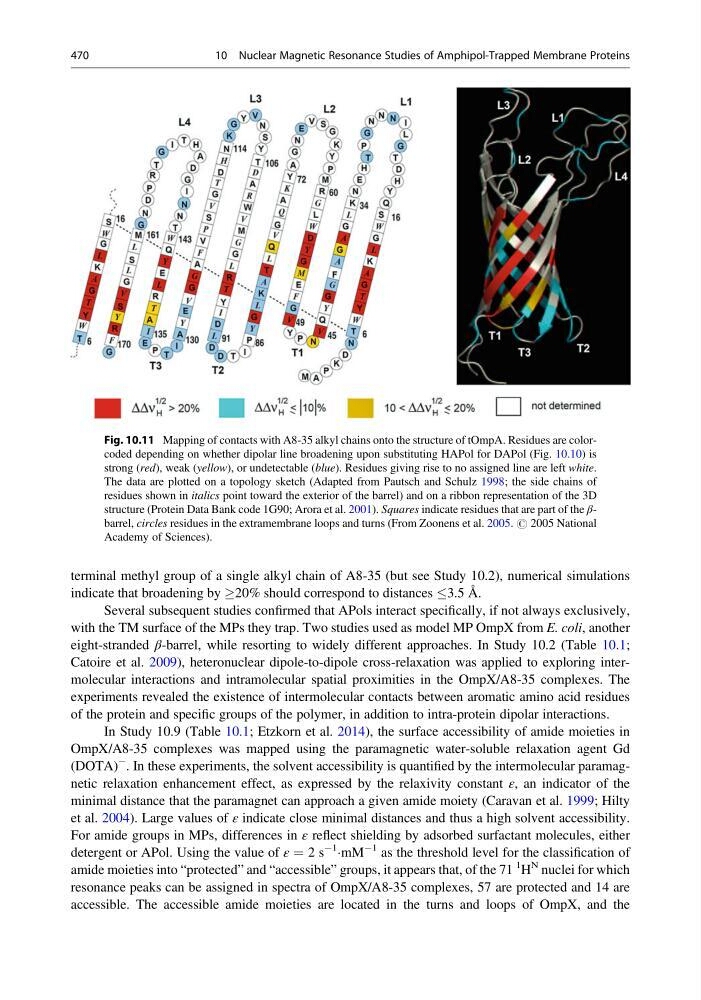
terminal methyl group of a single alkyl chain of A8-35 (but see Study 10.2), numerical simulations
indicate that broadening by !20% should correspond to distances 3.5 Å.
Several subsequent studies confirmed that APols interact specifically, if not always exclusively,
with the TM surface of the MPs they trap. Two studies used as model MP OmpX from E. coli, another
eight-stranded β-barrel, while resorting to widely different approaches. In Study 10.2 (Table 10.1;
Catoire et al. 2009), heteronuclear dipole-to-dipole cross-relaxation was applied to exploring intermolecular interactions and intramolecular spatial proximities in the OmpX/A8-35 complexes. The
experiments revealed the existence of intermolecular contacts between aromatic amino acid residues
of the protein and specific groups of the polymer, in addition to intra-protein dipolar interactions.
In Study 10.9 (Table 10.1; Etzkorn et al. 2014), the surface accessibility of amide moieties in
OmpX/A8-35 complexes was mapped using the paramagnetic water-soluble relaxation agent Gd
(DOTA)
À
. In these experiments, the solvent accessibility is quantified by the intermolecular paramagnetic relaxation enhancement effect, as expressed by the relaxivity constant ε, an indicator of the
minimal distance that the paramagnet can approach a given amide moiety (Caravan et al. 1999; Hilty
et al. 2004). Large values of ε indicate close minimal distances and thus a high solvent accessibility.
For amide groups in MPs, differences in ε reflect shielding by adsorbed surfactant molecules, either
detergent or APol. Using the value of ε ¼ 2 s
À1
ÁmM
À1 as the threshold level for the classification of
amide moieties into “protected” and “accessible” groups, it appears that, of the 71
1 H
N nuclei for which
resonance peaks can be assigned in spectra of OmpX/A8-35 complexes, 57 are protected and 14 are
accessible. The accessible amide moieties are located in the turns and loops of OmpX, and the
Fig. 10.11 Mapping of contacts with A8-35 alkyl chains onto the structure of tOmpA. Residues are colorcoded depending on whether dipolar line broadening upon substituting HAPol for DAPol (Fig. 10.10) is
strong (red), weak (yellow), or undetectable (blue). Residues giving rise to no assigned line are left white.
The data are plotted on a topology sketch (Adapted from Pautsch and Schulz 1998; the side chains of
residues shown in italics point toward the exterior of the barrel) and on a ribbon representation of the 3D
structure (Protein Data Bank code 1G90; Arora et al. 2001). Squares indicate residues that are part of the βbarrel, circles residues in the extramembrane loops and turns (From Zoonens et al. 2005. # 2005 National
Academy of Sciences).
470
10 Nuclear Magnetic Resonance Studies of Amphipol-Trapped Membrane Proteins
indicate that broadening by !20% should correspond to distances 3.5 Å.
Several subsequent studies confirmed that APols interact specifically, if not always exclusively,
with the TM surface of the MPs they trap. Two studies used as model MP OmpX from E. coli, another
eight-stranded β-barrel, while resorting to widely different approaches. In Study 10.2 (Table 10.1;
Catoire et al. 2009), heteronuclear dipole-to-dipole cross-relaxation was applied to exploring intermolecular interactions and intramolecular spatial proximities in the OmpX/A8-35 complexes. The
experiments revealed the existence of intermolecular contacts between aromatic amino acid residues
of the protein and specific groups of the polymer, in addition to intra-protein dipolar interactions.
In Study 10.9 (Table 10.1; Etzkorn et al. 2014), the surface accessibility of amide moieties in
OmpX/A8-35 complexes was mapped using the paramagnetic water-soluble relaxation agent Gd
(DOTA)
À
. In these experiments, the solvent accessibility is quantified by the intermolecular paramagnetic relaxation enhancement effect, as expressed by the relaxivity constant ε, an indicator of the
minimal distance that the paramagnet can approach a given amide moiety (Caravan et al. 1999; Hilty
et al. 2004). Large values of ε indicate close minimal distances and thus a high solvent accessibility.
For amide groups in MPs, differences in ε reflect shielding by adsorbed surfactant molecules, either
detergent or APol. Using the value of ε ¼ 2 s
À1
ÁmM
À1 as the threshold level for the classification of
amide moieties into “protected” and “accessible” groups, it appears that, of the 71
1 H
N nuclei for which
resonance peaks can be assigned in spectra of OmpX/A8-35 complexes, 57 are protected and 14 are
accessible. The accessible amide moieties are located in the turns and loops of OmpX, and the
Fig. 10.11 Mapping of contacts with A8-35 alkyl chains onto the structure of tOmpA. Residues are colorcoded depending on whether dipolar line broadening upon substituting HAPol for DAPol (Fig. 10.10) is
strong (red), weak (yellow), or undetectable (blue). Residues giving rise to no assigned line are left white.
The data are plotted on a topology sketch (Adapted from Pautsch and Schulz 1998; the side chains of
residues shown in italics point toward the exterior of the barrel) and on a ribbon representation of the 3D
structure (Protein Data Bank code 1G90; Arora et al. 2001). Squares indicate residues that are part of the βbarrel, circles residues in the extramembrane loops and turns (From Zoonens et al. 2005. # 2005 National
Academy of Sciences).
470
10 Nuclear Magnetic Resonance Studies of Amphipol-Trapped Membrane Proteins