

• In Study 9.7, complementary use was made of SANS and SAXS to study the solution
behavior of cytochrome bc 1 /A8-35 complexes as a function of the concentration of salt
and/or polyethylene glycol in the solution, with the view of providing guidelines for crystallization attempts (see Chap. 11, § 11.3.1, Fig. 11.13).
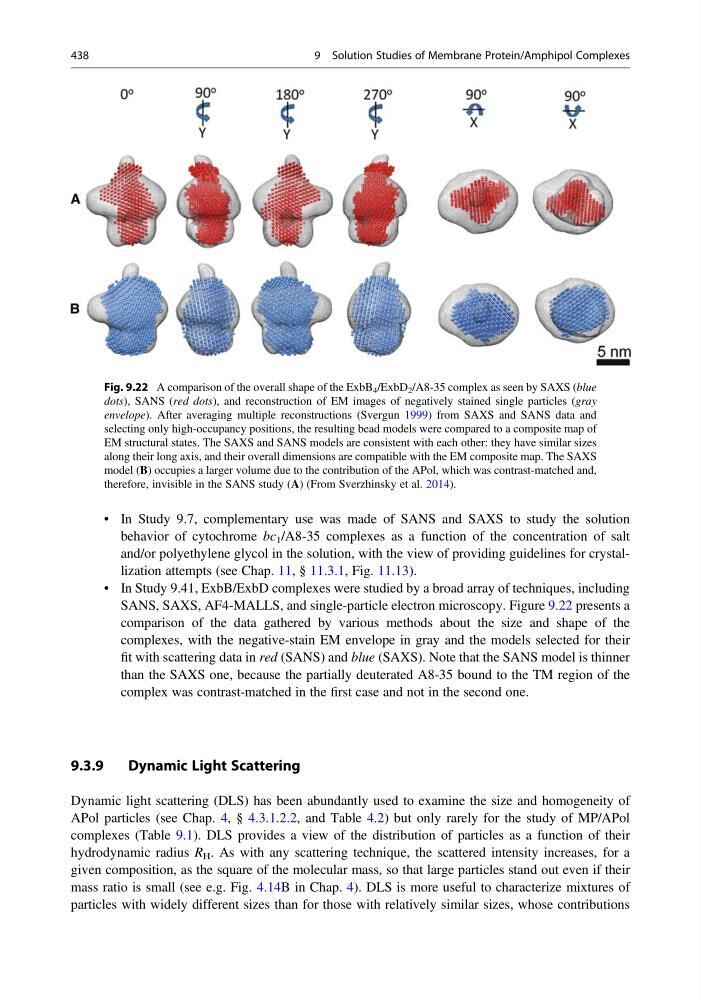
• In Study 9.41, ExbB/ExbD complexes were studied by a broad array of techniques, including
SANS, SAXS, AF4-MALLS, and single-particle electron microscopy. Figure 9.22 presents a
comparison of the data gathered by various methods about the size and shape of the
complexes, with the negative-stain EM envelope in gray and the models selected for their
fit with scattering data in red (SANS) and blue (SAXS). Note that the SANS model is thinner
than the SAXS one, because the partially deuterated A8-35 bound to the TM region of the
complex was contrast-matched in the first case and not in the second one.
9.3.9
Dynamic Light Scattering
Dynamic light scattering (DLS) has been abundantly used to examine the size and homogeneity of
APol particles (see Chap. 4, § 4.3.1.2.2, and Table 4.2) but only rarely for the study of MP/APol
complexes (Table 9.1). DLS provides a view of the distribution of particles as a function of their
hydrodynamic radius R H . As with any scattering technique, the scattered intensity increases, for a
given composition, as the square of the molecular mass, so that large particles stand out even if their
mass ratio is small (see e.g. Fig. 4.14B in Chap. 4). DLS is more useful to characterize mixtures of
particles with widely different sizes than for those with relatively similar sizes, whose contributions
Fig. 9.22 A comparison of the overall shape of the ExbB 4 /ExbD 2 /A8-35 complex as seen by SAXS (blue
dots), SANS (red dots), and reconstruction of EM images of negatively stained single particles (gray
envelope). After averaging multiple reconstructions (Svergun 1999) from SAXS and SANS data and
selecting only high-occupancy positions, the resulting bead models were compared to a composite map of
EM structural states. The SAXS and SANS models are consistent with each other: they have similar sizes
along their long axis, and their overall dimensions are compatible with the EM composite map. The SAXS
model (B) occupies a larger volume due to the contribution of the APol, which was contrast-matched and,
therefore, invisible in the SANS study (A) (From Sverzhinsky et al. 2014).
438
9 Solution Studies of Membrane Protein/Amphipol Complexes
behavior of cytochrome bc 1 /A8-35 complexes as a function of the concentration of salt
and/or polyethylene glycol in the solution, with the view of providing guidelines for crystallization attempts (see Chap. 11, § 11.3.1, Fig. 11.13).
• In Study 9.41, ExbB/ExbD complexes were studied by a broad array of techniques, including
SANS, SAXS, AF4-MALLS, and single-particle electron microscopy. Figure 9.22 presents a
comparison of the data gathered by various methods about the size and shape of the
complexes, with the negative-stain EM envelope in gray and the models selected for their
fit with scattering data in red (SANS) and blue (SAXS). Note that the SANS model is thinner
than the SAXS one, because the partially deuterated A8-35 bound to the TM region of the
complex was contrast-matched in the first case and not in the second one.
9.3.9
Dynamic Light Scattering
Dynamic light scattering (DLS) has been abundantly used to examine the size and homogeneity of
APol particles (see Chap. 4, § 4.3.1.2.2, and Table 4.2) but only rarely for the study of MP/APol
complexes (Table 9.1). DLS provides a view of the distribution of particles as a function of their
hydrodynamic radius R H . As with any scattering technique, the scattered intensity increases, for a
given composition, as the square of the molecular mass, so that large particles stand out even if their
mass ratio is small (see e.g. Fig. 4.14B in Chap. 4). DLS is more useful to characterize mixtures of
particles with widely different sizes than for those with relatively similar sizes, whose contributions
Fig. 9.22 A comparison of the overall shape of the ExbB 4 /ExbD 2 /A8-35 complex as seen by SAXS (blue
dots), SANS (red dots), and reconstruction of EM images of negatively stained single particles (gray
envelope). After averaging multiple reconstructions (Svergun 1999) from SAXS and SANS data and
selecting only high-occupancy positions, the resulting bead models were compared to a composite map of
EM structural states. The SAXS and SANS models are consistent with each other: they have similar sizes
along their long axis, and their overall dimensions are compatible with the EM composite map. The SAXS
model (B) occupies a larger volume due to the contribution of the APol, which was contrast-matched and,
therefore, invisible in the SANS study (A) (From Sverzhinsky et al. 2014).
438
9 Solution Studies of Membrane Protein/Amphipol Complexes