

overlap. Examples of DLS studies of the complexes formed between various APols and
non-membrane hydrophobic proteins are shown in Study 9.20.
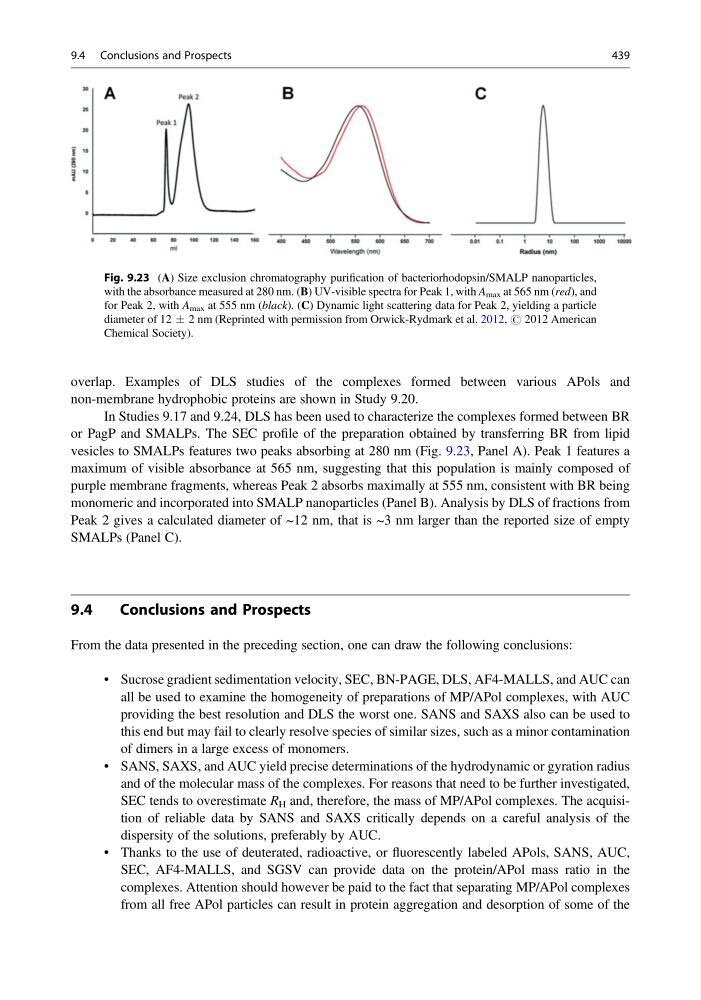
In Studies 9.17 and 9.24, DLS has been used to characterize the complexes formed between BR
or PagP and SMALPs. The SEC profile of the preparation obtained by transferring BR from lipid
vesicles to SMALPs features two peaks absorbing at 280 nm (Fig. 9.23, Panel A). Peak 1 features a
maximum of visible absorbance at 565 nm, suggesting that this population is mainly composed of
purple membrane fragments, whereas Peak 2 absorbs maximally at 555 nm, consistent with BR being
monomeric and incorporated into SMALP nanoparticles (Panel B). Analysis by DLS of fractions from
Peak 2 gives a calculated diameter of ~12 nm, that is ~3 nm larger than the reported size of empty
SMALPs (Panel C).
9.4
Conclusions and Prospects
From the data presented in the preceding section, one can draw the following conclusions:
• Sucrose gradient sedimentation velocity, SEC, BN-PAGE, DLS, AF4-MALLS, and AUC can
all be used to examine the homogeneity of preparations of MP/APol complexes, with AUC
providing the best resolution and DLS the worst one. SANS and SAXS also can be used to
this end but may fail to clearly resolve species of similar sizes, such as a minor contamination
of dimers in a large excess of monomers.
• SANS, SAXS, and AUC yield precise determinations of the hydrodynamic or gyration radius
and of the molecular mass of the complexes. For reasons that need to be further investigated,
SEC tends to overestimate R H and, therefore, the mass of MP/APol complexes. The acquisition of reliable data by SANS and SAXS critically depends on a careful analysis of the
dispersity of the solutions, preferably by AUC.
• Thanks to the use of deuterated, radioactive, or fluorescently labeled APols, SANS, AUC,
SEC, AF4-MALLS, and SGSV can provide data on the protein/APol mass ratio in the
complexes. Attention should however be paid to the fact that separating MP/APol complexes
from all free APol particles can result in protein aggregation and desorption of some of the
Fig. 9.23 (A) Size exclusion chromatography purification of bacteriorhodopsin/SMALP nanoparticles,
with the absorbance measured at 280 nm. (B) UV-visible spectra for Peak 1, with A max at 565 nm (red), and
for Peak 2, with A max at 555 nm (black). (C) Dynamic light scattering data for Peak 2, yielding a particle
diameter of 12 Æ 2 nm (Reprinted with permission from Orwick-Rydmark et al. 2012, # 2012 American
Chemical Society).
9.4 Conclusions and Prospects
439
non-membrane hydrophobic proteins are shown in Study 9.20.
In Studies 9.17 and 9.24, DLS has been used to characterize the complexes formed between BR
or PagP and SMALPs. The SEC profile of the preparation obtained by transferring BR from lipid
vesicles to SMALPs features two peaks absorbing at 280 nm (Fig. 9.23, Panel A). Peak 1 features a
maximum of visible absorbance at 565 nm, suggesting that this population is mainly composed of
purple membrane fragments, whereas Peak 2 absorbs maximally at 555 nm, consistent with BR being
monomeric and incorporated into SMALP nanoparticles (Panel B). Analysis by DLS of fractions from
Peak 2 gives a calculated diameter of ~12 nm, that is ~3 nm larger than the reported size of empty
SMALPs (Panel C).
9.4
Conclusions and Prospects
From the data presented in the preceding section, one can draw the following conclusions:
• Sucrose gradient sedimentation velocity, SEC, BN-PAGE, DLS, AF4-MALLS, and AUC can
all be used to examine the homogeneity of preparations of MP/APol complexes, with AUC
providing the best resolution and DLS the worst one. SANS and SAXS also can be used to
this end but may fail to clearly resolve species of similar sizes, such as a minor contamination
of dimers in a large excess of monomers.
• SANS, SAXS, and AUC yield precise determinations of the hydrodynamic or gyration radius
and of the molecular mass of the complexes. For reasons that need to be further investigated,
SEC tends to overestimate R H and, therefore, the mass of MP/APol complexes. The acquisition of reliable data by SANS and SAXS critically depends on a careful analysis of the
dispersity of the solutions, preferably by AUC.
• Thanks to the use of deuterated, radioactive, or fluorescently labeled APols, SANS, AUC,
SEC, AF4-MALLS, and SGSV can provide data on the protein/APol mass ratio in the
complexes. Attention should however be paid to the fact that separating MP/APol complexes
from all free APol particles can result in protein aggregation and desorption of some of the
Fig. 9.23 (A) Size exclusion chromatography purification of bacteriorhodopsin/SMALP nanoparticles,
with the absorbance measured at 280 nm. (B) UV-visible spectra for Peak 1, with A max at 565 nm (red), and
for Peak 2, with A max at 555 nm (black). (C) Dynamic light scattering data for Peak 2, yielding a particle
diameter of 12 Æ 2 nm (Reprinted with permission from Orwick-Rydmark et al. 2012, # 2012 American
Chemical Society).
9.4 Conclusions and Prospects
439