

Figure 9.13, panels D and E, shows the expected individual contributions to M b of the different
partners in a complex comprised of one monomer of BR and, per gram of protein, 0.38 g lipid
(as inferred from chemical analysis) and 1.8 g APol (as deduced from sedimentation velocity
experiments), as well as their sum (solid red lines). For BR/HAPol complexes, experimental values
of M b are slightly larger than calculated ones. This small discrepancy may be related to the slight
heterogeneity of the sample and/or to an underevaluation of the amount of bound HAPol – assuming
2.2 g HAPol/g BR (dotted red line) gives a better fit for purely monomeric BR – but the two
phenomena of course could well contribute. For BR/DAPol complexes, a relatively good fit is obtained
assuming the binding of 1.8 g DAPol/g BR and M w /M 1 (defined in the legend to Table 9.2) to be 1.3
(open symbols), as found for this sample using sedimentation velocity analysis. Complementary
analyses of BR/A8-35 complexes using SANS will be presented in § 9.3.8 and their consistency
with AUC data discussed.
In Study 9.41, advantage was taken on the existence of a fluorescent, NBD-labeled form of
A8-35, FAPol NBD (Zoonens et al. 2007; Le Bon et al. 2014b), used as a tracer, to follow the APol
distribution at λ ¼ 490 nm, whereas both the protein (ExbB/ExbD complexes) and the APol were
detected at λ ¼ 280 nm (Figs. 9.14 and 9.15).
In Study 9.47, sedimentation velocity AUC was applied to the analysis of complexes between
SMA, lipids, and the trimeric AcrB multidrug transporter (Fig. 9.15) . The peaks are broad, which is
thought to result from noise in the data more than from an intrinsic polydispersity of the samples, but
they do reveal the existence of two population of particles, the smallest one a SMALP-trapped trimer
(s % 4.8 S) and the other a doublet thereof (s % 8.5 S), whose relative proportion and exact
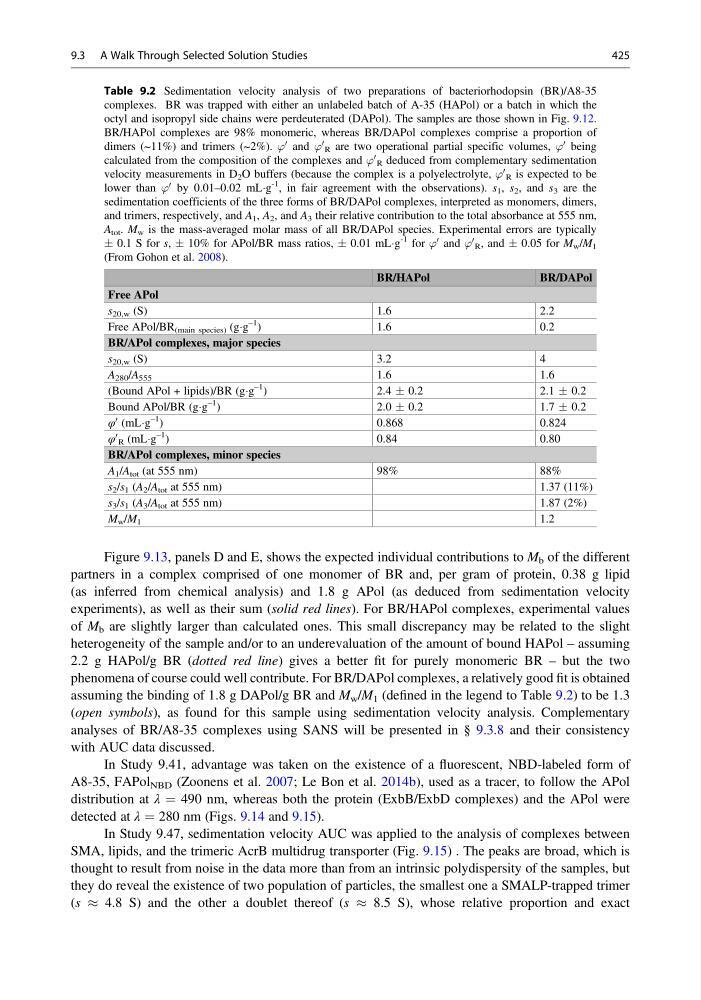
Table 9.2 Sedimentation velocity analysis of two preparations of bacteriorhodopsin (BR)/A8-35
complexes. BR was trapped with either an unlabeled batch of A-35 (HAPol) or a batch in which the
octyl and isopropyl side chains were perdeuterated (DAPol). The samples are those shown in Fig. 9.12.
BR/HAPol complexes are 98% monomeric, whereas BR/DAPol complexes comprise a proportion of
dimers (~11%) and trimers (~2%). ’
0 and ’
0
R are two operational partial specific volumes, ’
0 being
calculated from the composition of the complexes and ’
0
R deduced from complementary sedimentation
velocity measurements in D 2 O buffers (because the complex is a polyelectrolyte, ’
0
R is expected to be
lower than ’
0 by 0.01–0.02 mLÁg
-1
, in fair agreement with the observations). s 1 , s 2 , and s 3 are the
sedimentation coefficients of the three forms of BR/DAPol complexes, interpreted as monomers, dimers,
and trimers, respectively, and A 1 , A 2 , and A 3 their relative contribution to the total absorbance at 555 nm,
A tot . M w is the mass-averaged molar mass of all BR/DAPol species. Experimental errors are typically
Æ 0.1 S for s, Æ 10% for APol/BR mass ratios, Æ 0.01 mLÁg
-1 for ’
0 and ’
0
R , and Æ 0.05 for M w /M 1
(From Gohon et al. 2008).
BR/HAPol
BR/DAPol
Free APol
s 20,w (S)
1.6
2.2
Free APol/BR (main species) (gÁg
–1
)
1.6
0.2
BR/APol complexes, major species
s 20,w (S)
3.2
4
A 280 /A 555
1.6
1.6
(Bound APol + lipids)/BR (gÁg
–1
)
2.4 Æ 0.2
2.1 Æ 0.2
Bound APol/BR (gÁg
–1
)
2.0 Æ 0.2
1.7 Æ 0.2
φ
0 (mLÁg
–1
)
0.868
0.824
φ
0
R (mLÁg
–1
)
0.84
0.80
BR/APol complexes, minor species
A 1 /A tot (at 555 nm)
98%
88%
s 2 /s 1 (A 2 /A tot at 555 nm)
1.37 (11%)
s 3 /s 1 (A 3 /A tot at 555 nm)
1.87 (2%)
M w /M 1
1.2
9.3 A Walk Through Selected Solution Studies
425
partners in a complex comprised of one monomer of BR and, per gram of protein, 0.38 g lipid
(as inferred from chemical analysis) and 1.8 g APol (as deduced from sedimentation velocity
experiments), as well as their sum (solid red lines). For BR/HAPol complexes, experimental values
of M b are slightly larger than calculated ones. This small discrepancy may be related to the slight
heterogeneity of the sample and/or to an underevaluation of the amount of bound HAPol – assuming
2.2 g HAPol/g BR (dotted red line) gives a better fit for purely monomeric BR – but the two
phenomena of course could well contribute. For BR/DAPol complexes, a relatively good fit is obtained
assuming the binding of 1.8 g DAPol/g BR and M w /M 1 (defined in the legend to Table 9.2) to be 1.3
(open symbols), as found for this sample using sedimentation velocity analysis. Complementary
analyses of BR/A8-35 complexes using SANS will be presented in § 9.3.8 and their consistency
with AUC data discussed.
In Study 9.41, advantage was taken on the existence of a fluorescent, NBD-labeled form of
A8-35, FAPol NBD (Zoonens et al. 2007; Le Bon et al. 2014b), used as a tracer, to follow the APol
distribution at λ ¼ 490 nm, whereas both the protein (ExbB/ExbD complexes) and the APol were
detected at λ ¼ 280 nm (Figs. 9.14 and 9.15).
In Study 9.47, sedimentation velocity AUC was applied to the analysis of complexes between
SMA, lipids, and the trimeric AcrB multidrug transporter (Fig. 9.15) . The peaks are broad, which is
thought to result from noise in the data more than from an intrinsic polydispersity of the samples, but
they do reveal the existence of two population of particles, the smallest one a SMALP-trapped trimer
(s % 4.8 S) and the other a doublet thereof (s % 8.5 S), whose relative proportion and exact
Table 9.2 Sedimentation velocity analysis of two preparations of bacteriorhodopsin (BR)/A8-35
complexes. BR was trapped with either an unlabeled batch of A-35 (HAPol) or a batch in which the
octyl and isopropyl side chains were perdeuterated (DAPol). The samples are those shown in Fig. 9.12.
BR/HAPol complexes are 98% monomeric, whereas BR/DAPol complexes comprise a proportion of
dimers (~11%) and trimers (~2%). ’
0 and ’
0
R are two operational partial specific volumes, ’
0 being
calculated from the composition of the complexes and ’
0
R deduced from complementary sedimentation
velocity measurements in D 2 O buffers (because the complex is a polyelectrolyte, ’
0
R is expected to be
lower than ’
0 by 0.01–0.02 mLÁg
-1
, in fair agreement with the observations). s 1 , s 2 , and s 3 are the
sedimentation coefficients of the three forms of BR/DAPol complexes, interpreted as monomers, dimers,
and trimers, respectively, and A 1 , A 2 , and A 3 their relative contribution to the total absorbance at 555 nm,
A tot . M w is the mass-averaged molar mass of all BR/DAPol species. Experimental errors are typically
Æ 0.1 S for s, Æ 10% for APol/BR mass ratios, Æ 0.01 mLÁg
-1 for ’
0 and ’
0
R , and Æ 0.05 for M w /M 1
(From Gohon et al. 2008).
BR/HAPol
BR/DAPol
Free APol
s 20,w (S)
1.6
2.2
Free APol/BR (main species) (gÁg
–1
)
1.6
0.2
BR/APol complexes, major species
s 20,w (S)
3.2
4
A 280 /A 555
1.6
1.6
(Bound APol + lipids)/BR (gÁg
–1
)
2.4 Æ 0.2
2.1 Æ 0.2
Bound APol/BR (gÁg
–1
)
2.0 Æ 0.2
1.7 Æ 0.2
φ
0 (mLÁg
–1
)
0.868
0.824
φ
0
R (mLÁg
–1
)
0.84
0.80
BR/APol complexes, minor species
A 1 /A tot (at 555 nm)
98%
88%
s 2 /s 1 (A 2 /A tot at 555 nm)
1.37 (11%)
s 3 /s 1 (A 3 /A tot at 555 nm)
1.87 (2%)
M w /M 1
1.2
9.3 A Walk Through Selected Solution Studies
425