

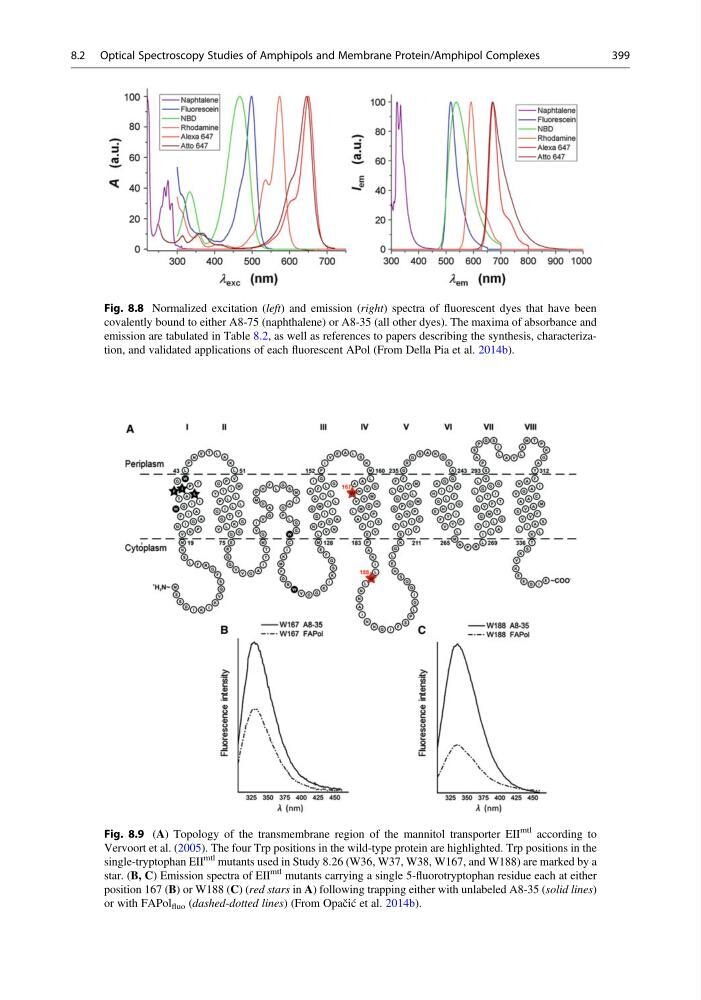
Fig. 8.8 Normalized excitation (left) and emission (right) spectra of fluorescent dyes that have been
covalently bound to either A8-75 (naphthalene) or A8-35 (all other dyes). The maxima of absorbance and
emission are tabulated in Table 8.2, as well as references to papers describing the synthesis, characterization, and validated applications of each fluorescent APol (From Della Pia et al. 2014b).
Fig. 8.9 (A) Topology of the transmembrane region of the mannitol transporter EII
mtl according to
Vervoort et al. (2005). The four Trp positions in the wild-type protein are highlighted. Trp positions in the
single-tryptophan EII
mtl mutants used in Study 8.26 (W36, W37, W38, W167, and W188) are marked by a
star. (B, C) Emission spectra of EII
mtl mutants carrying a single 5-fluorotryptophan residue each at either
position 167 (B) or W188 (C) (red stars in A) following trapping either with unlabeled A8-35 (solid lines)
or with FAPol fluo (dashed-dotted lines) (From Opačić et al. 2014b).
8.2 Optical Spectroscopy Studies of Amphipols and Membrane Protein/Amphipol Complexes
399
covalently bound to either A8-75 (naphthalene) or A8-35 (all other dyes). The maxima of absorbance and
emission are tabulated in Table 8.2, as well as references to papers describing the synthesis, characterization, and validated applications of each fluorescent APol (From Della Pia et al. 2014b).
Fig. 8.9 (A) Topology of the transmembrane region of the mannitol transporter EII
mtl according to
Vervoort et al. (2005). The four Trp positions in the wild-type protein are highlighted. Trp positions in the
single-tryptophan EII
mtl mutants used in Study 8.26 (W36, W37, W38, W167, and W188) are marked by a
star. (B, C) Emission spectra of EII
mtl mutants carrying a single 5-fluorotryptophan residue each at either
position 167 (B) or W188 (C) (red stars in A) following trapping either with unlabeled A8-35 (solid lines)
or with FAPol fluo (dashed-dotted lines) (From Opačić et al. 2014b).
8.2 Optical Spectroscopy Studies of Amphipols and Membrane Protein/Amphipol Complexes
399