

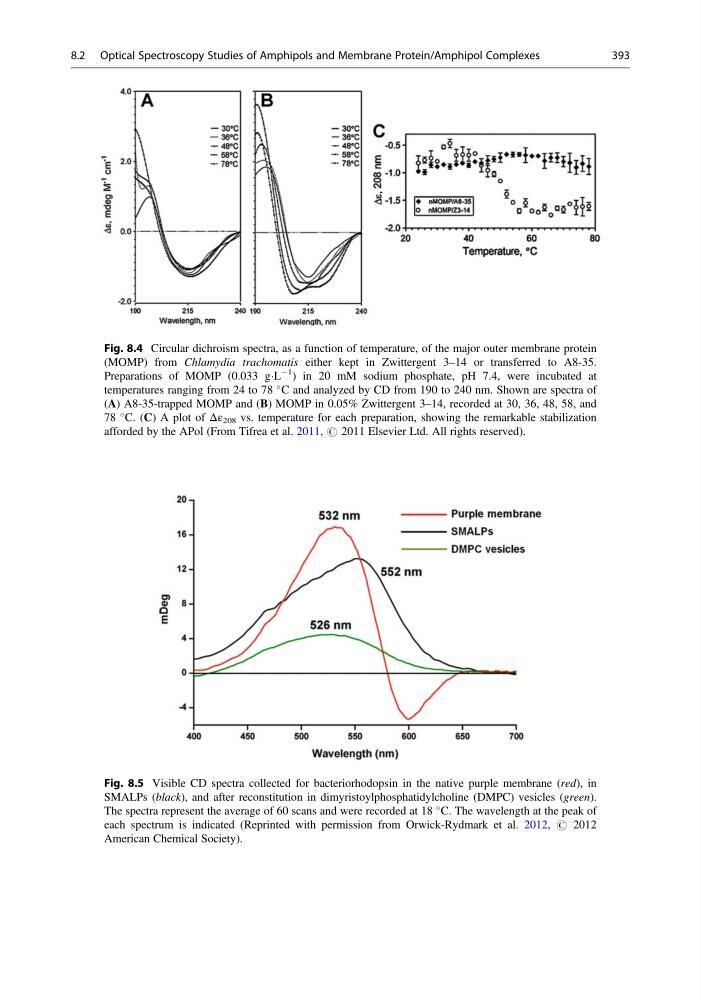
Fig. 8.4 Circular dichroism spectra, as a function of temperature, of the major outer membrane protein
(MOMP) from Chlamydia trachomatis either kept in Zwittergent 3–14 or transferred to A8-35.
Preparations of MOMP (0.033 gÁL
À1
) in 20 mM sodium phosphate, pH 7.4, were incubated at
temperatures ranging from 24 to 78
C and analyzed by CD from 190 to 240 nm. Shown are spectra of
(A) A8-35-trapped MOMP and (B) MOMP in 0.05% Zwittergent 3–14, recorded at 30, 36, 48, 58, and
78
C. (C) A plot of Δε 208 vs. temperature for each preparation, showing the remarkable stabilization
afforded by the APol (From Tifrea et al. 2011, # 2011 Elsevier Ltd. All rights reserved).
Fig. 8.5 Visible CD spectra collected for bacteriorhodopsin in the native purple membrane (red), in
SMALPs (black), and after reconstitution in dimyristoylphosphatidylcholine (DMPC) vesicles (green).
The spectra represent the average of 60 scans and were recorded at 18
C. The wavelength at the peak of
each spectrum is indicated (Reprinted with permission from Orwick-Rydmark et al. 2012, # 2012
American Chemical Society).
8.2 Optical Spectroscopy Studies of Amphipols and Membrane Protein/Amphipol Complexes
393
(MOMP) from Chlamydia trachomatis either kept in Zwittergent 3–14 or transferred to A8-35.
Preparations of MOMP (0.033 gÁL
À1
) in 20 mM sodium phosphate, pH 7.4, were incubated at
temperatures ranging from 24 to 78
C and analyzed by CD from 190 to 240 nm. Shown are spectra of
(A) A8-35-trapped MOMP and (B) MOMP in 0.05% Zwittergent 3–14, recorded at 30, 36, 48, 58, and
78
C. (C) A plot of Δε 208 vs. temperature for each preparation, showing the remarkable stabilization
afforded by the APol (From Tifrea et al. 2011, # 2011 Elsevier Ltd. All rights reserved).
Fig. 8.5 Visible CD spectra collected for bacteriorhodopsin in the native purple membrane (red), in
SMALPs (black), and after reconstitution in dimyristoylphosphatidylcholine (DMPC) vesicles (green).
The spectra represent the average of 60 scans and were recorded at 18
C. The wavelength at the peak of
each spectrum is indicated (Reprinted with permission from Orwick-Rydmark et al. 2012, # 2012
American Chemical Society).
8.2 Optical Spectroscopy Studies of Amphipols and Membrane Protein/Amphipol Complexes
393