

using smaller increments might have led to a lower, more accurate figure. This may possibly explain
some features of the model.
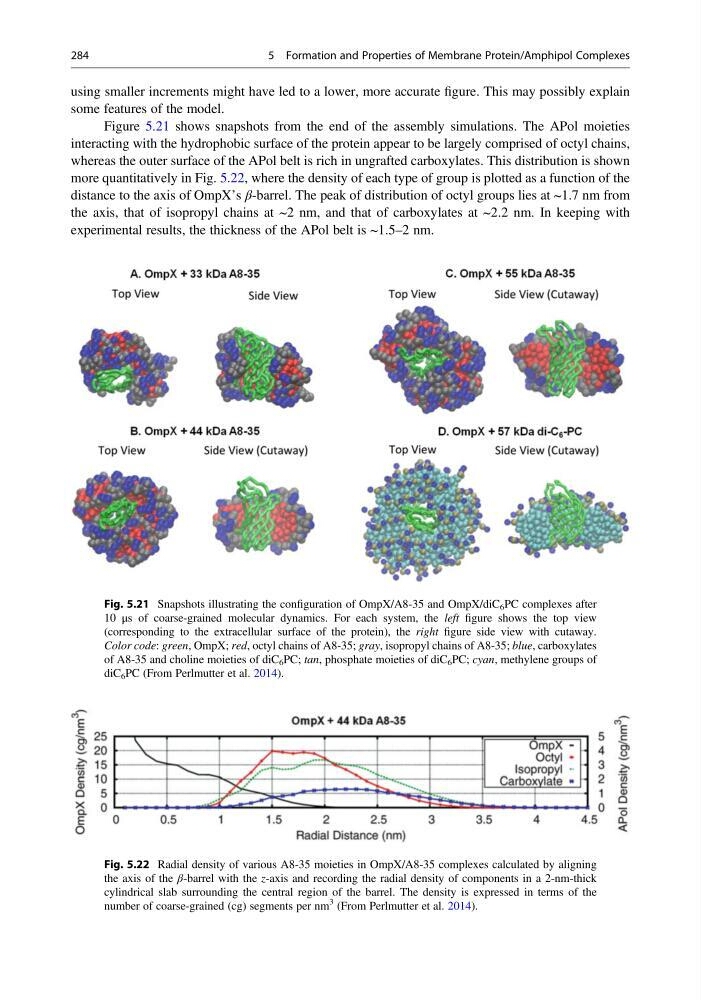
Figure 5.21 shows snapshots from the end of the assembly simulations. The APol moieties
interacting with the hydrophobic surface of the protein appear to be largely comprised of octyl chains,
whereas the outer surface of the APol belt is rich in ungrafted carboxylates. This distribution is shown
more quantitatively in Fig. 5.22, where the density of each type of group is plotted as a function of the
distance to the axis of OmpX’s β-barrel. The peak of distribution of octyl groups lies at ~1.7 nm from
the axis, that of isopropyl chains at ~2 nm, and that of carboxylates at ~2.2 nm. In keeping with
experimental results, the thickness of the APol belt is ~1.5–2 nm.
Fig. 5.21 Snapshots illustrating the configuration of OmpX/A8-35 and OmpX/diC 6 PC complexes after
10 μs of coarse-grained molecular dynamics. For each system, the left figure shows the top view
(corresponding to the extracellular surface of the protein), the right figure side view with cutaway.
Color code: green, OmpX; red, octyl chains of A8-35; gray, isopropyl chains of A8-35; blue, carboxylates
of A8-35 and choline moieties of diC 6 PC; tan, phosphate moieties of diC 6 PC; cyan, methylene groups of
diC 6 PC (From Perlmutter et al. 2014).
Fig. 5.22 Radial density of various A8-35 moieties in OmpX/A8-35 complexes calculated by aligning
the axis of the β-barrel with the z-axis and recording the radial density of components in a 2-nm-thick
cylindrical slab surrounding the central region of the barrel. The density is expressed in terms of the
number of coarse-grained (cg) segments per nm
3 (From Perlmutter et al. 2014).
284
5 Formation and Properties of Membrane Protein/Amphipol Complexes
some features of the model.
Figure 5.21 shows snapshots from the end of the assembly simulations. The APol moieties
interacting with the hydrophobic surface of the protein appear to be largely comprised of octyl chains,
whereas the outer surface of the APol belt is rich in ungrafted carboxylates. This distribution is shown
more quantitatively in Fig. 5.22, where the density of each type of group is plotted as a function of the
distance to the axis of OmpX’s β-barrel. The peak of distribution of octyl groups lies at ~1.7 nm from
the axis, that of isopropyl chains at ~2 nm, and that of carboxylates at ~2.2 nm. In keeping with
experimental results, the thickness of the APol belt is ~1.5–2 nm.
Fig. 5.21 Snapshots illustrating the configuration of OmpX/A8-35 and OmpX/diC 6 PC complexes after
10 μs of coarse-grained molecular dynamics. For each system, the left figure shows the top view
(corresponding to the extracellular surface of the protein), the right figure side view with cutaway.
Color code: green, OmpX; red, octyl chains of A8-35; gray, isopropyl chains of A8-35; blue, carboxylates
of A8-35 and choline moieties of diC 6 PC; tan, phosphate moieties of diC 6 PC; cyan, methylene groups of
diC 6 PC (From Perlmutter et al. 2014).
Fig. 5.22 Radial density of various A8-35 moieties in OmpX/A8-35 complexes calculated by aligning
the axis of the β-barrel with the z-axis and recording the radial density of components in a 2-nm-thick
cylindrical slab surrounding the central region of the barrel. The density is expressed in terms of the
number of coarse-grained (cg) segments per nm
3 (From Perlmutter et al. 2014).
284
5 Formation and Properties of Membrane Protein/Amphipol Complexes