

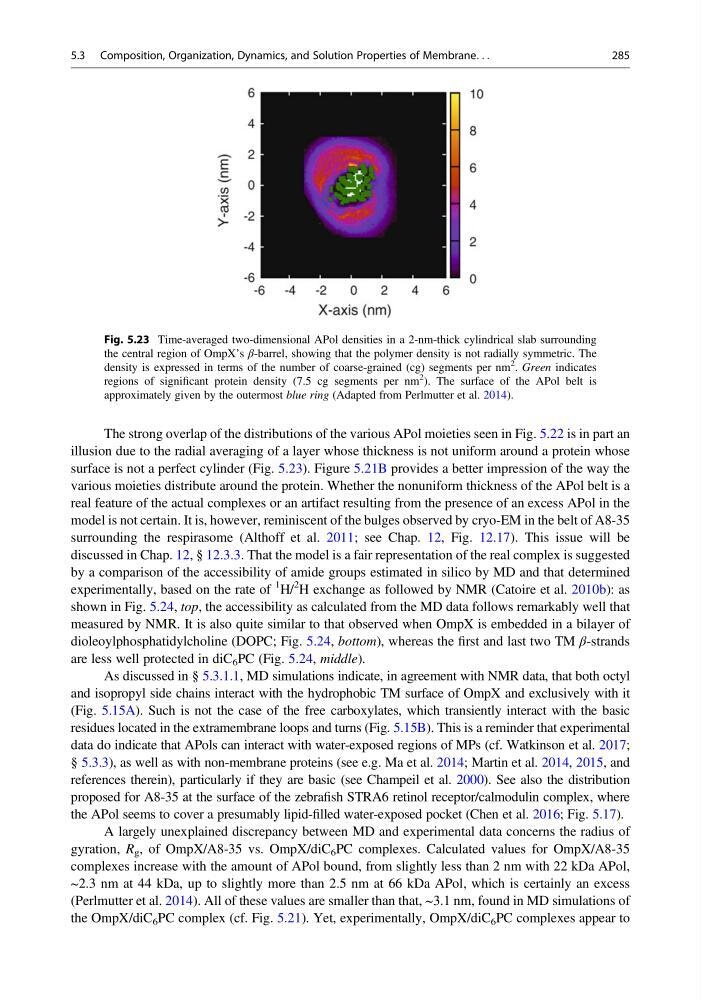
The strong overlap of the distributions of the various APol moieties seen in Fig. 5.22 is in part an
illusion due to the radial averaging of a layer whose thickness is not uniform around a protein whose
surface is not a perfect cylinder (Fig. 5.23). Figure 5.21B provides a better impression of the way the
various moieties distribute around the protein. Whether the nonuniform thickness of the APol belt is a
real feature of the actual complexes or an artifact resulting from the presence of an excess APol in the
model is not certain. It is, however, reminiscent of the bulges observed by cryo-EM in the belt of A8-35
surrounding the respirasome (Althoff et al. 2011; see Chap. 12, Fig. 12.17). This issue will be
discussed in Chap. 12, § 12.3.3. That the model is a fair representation of the real complex is suggested
by a comparison of the accessibility of amide groups estimated in silico by MD and that determined
experimentally, based on the rate of
1 H/
2 H exchange as followed by NMR (Catoire et al. 2010b): as
shown in Fig. 5.24, top, the accessibility as calculated from the MD data follows remarkably well that
measured by NMR. It is also quite similar to that observed when OmpX is embedded in a bilayer of
dioleoylphosphatidylcholine (DOPC; Fig. 5.24, bottom), whereas the first and last two TM β-strands
are less well protected in diC 6 PC (Fig. 5.24, middle).
As discussed in § 5.3.1.1, MD simulations indicate, in agreement with NMR data, that both octyl
and isopropyl side chains interact with the hydrophobic TM surface of OmpX and exclusively with it
(Fig. 5.15A). Such is not the case of the free carboxylates, which transiently interact with the basic
residues located in the extramembrane loops and turns (Fig. 5.15B). This is a reminder that experimental
data do indicate that APols can interact with water-exposed regions of MPs (cf. Watkinson et al. 2017;
§ 5.3.3), as well as with non-membrane proteins (see e.g. Ma et al. 2014; Martin et al. 2014, 2015, and
references therein), particularly if they are basic (see Champeil et al. 2000). See also the distribution
proposed for A8-35 at the surface of the zebrafish STRA6 retinol receptor/calmodulin complex, where
the APol seems to cover a presumably lipid-filled water-exposed pocket (Chen et al. 2016; Fig. 5.17).
A largely unexplained discrepancy between MD and experimental data concerns the radius of
gyration, R g , of OmpX/A8-35 vs. OmpX/diC 6 PC complexes. Calculated values for OmpX/A8-35
complexes increase with the amount of APol bound, from slightly less than 2 nm with 22 kDa APol,
~2.3 nm at 44 kDa, up to slightly more than 2.5 nm at 66 kDa APol, which is certainly an excess
(Perlmutter et al. 2014). All of these values are smaller than that, ~3.1 nm, found in MD simulations of
the OmpX/diC 6 PC complex (cf. Fig. 5.21). Yet, experimentally, OmpX/diC 6 PC complexes appear to
Fig. 5.23 Time-averaged two-dimensional APol densities in a 2-nm-thick cylindrical slab surrounding
the central region of OmpX’s β-barrel, showing that the polymer density is not radially symmetric. The
density is expressed in terms of the number of coarse-grained (cg) segments per nm
2
. Green indicates
regions of significant protein density (7.5 cg segments per nm
2
). The surface of the APol belt is
approximately given by the outermost blue ring (Adapted from Perlmutter et al. 2014).
5.3 Composition, Organization, Dynamics, and Solution Properties of Membrane. . .
285
illusion due to the radial averaging of a layer whose thickness is not uniform around a protein whose
surface is not a perfect cylinder (Fig. 5.23). Figure 5.21B provides a better impression of the way the
various moieties distribute around the protein. Whether the nonuniform thickness of the APol belt is a
real feature of the actual complexes or an artifact resulting from the presence of an excess APol in the
model is not certain. It is, however, reminiscent of the bulges observed by cryo-EM in the belt of A8-35
surrounding the respirasome (Althoff et al. 2011; see Chap. 12, Fig. 12.17). This issue will be
discussed in Chap. 12, § 12.3.3. That the model is a fair representation of the real complex is suggested
by a comparison of the accessibility of amide groups estimated in silico by MD and that determined
experimentally, based on the rate of
1 H/
2 H exchange as followed by NMR (Catoire et al. 2010b): as
shown in Fig. 5.24, top, the accessibility as calculated from the MD data follows remarkably well that
measured by NMR. It is also quite similar to that observed when OmpX is embedded in a bilayer of
dioleoylphosphatidylcholine (DOPC; Fig. 5.24, bottom), whereas the first and last two TM β-strands
are less well protected in diC 6 PC (Fig. 5.24, middle).
As discussed in § 5.3.1.1, MD simulations indicate, in agreement with NMR data, that both octyl
and isopropyl side chains interact with the hydrophobic TM surface of OmpX and exclusively with it
(Fig. 5.15A). Such is not the case of the free carboxylates, which transiently interact with the basic
residues located in the extramembrane loops and turns (Fig. 5.15B). This is a reminder that experimental
data do indicate that APols can interact with water-exposed regions of MPs (cf. Watkinson et al. 2017;
§ 5.3.3), as well as with non-membrane proteins (see e.g. Ma et al. 2014; Martin et al. 2014, 2015, and
references therein), particularly if they are basic (see Champeil et al. 2000). See also the distribution
proposed for A8-35 at the surface of the zebrafish STRA6 retinol receptor/calmodulin complex, where
the APol seems to cover a presumably lipid-filled water-exposed pocket (Chen et al. 2016; Fig. 5.17).
A largely unexplained discrepancy between MD and experimental data concerns the radius of
gyration, R g , of OmpX/A8-35 vs. OmpX/diC 6 PC complexes. Calculated values for OmpX/A8-35
complexes increase with the amount of APol bound, from slightly less than 2 nm with 22 kDa APol,
~2.3 nm at 44 kDa, up to slightly more than 2.5 nm at 66 kDa APol, which is certainly an excess
(Perlmutter et al. 2014). All of these values are smaller than that, ~3.1 nm, found in MD simulations of
the OmpX/diC 6 PC complex (cf. Fig. 5.21). Yet, experimentally, OmpX/diC 6 PC complexes appear to
Fig. 5.23 Time-averaged two-dimensional APol densities in a 2-nm-thick cylindrical slab surrounding
the central region of OmpX’s β-barrel, showing that the polymer density is not radially symmetric. The
density is expressed in terms of the number of coarse-grained (cg) segments per nm
2
. Green indicates
regions of significant protein density (7.5 cg segments per nm
2
). The surface of the APol belt is
approximately given by the outermost blue ring (Adapted from Perlmutter et al. 2014).
5.3 Composition, Organization, Dynamics, and Solution Properties of Membrane. . .
285