

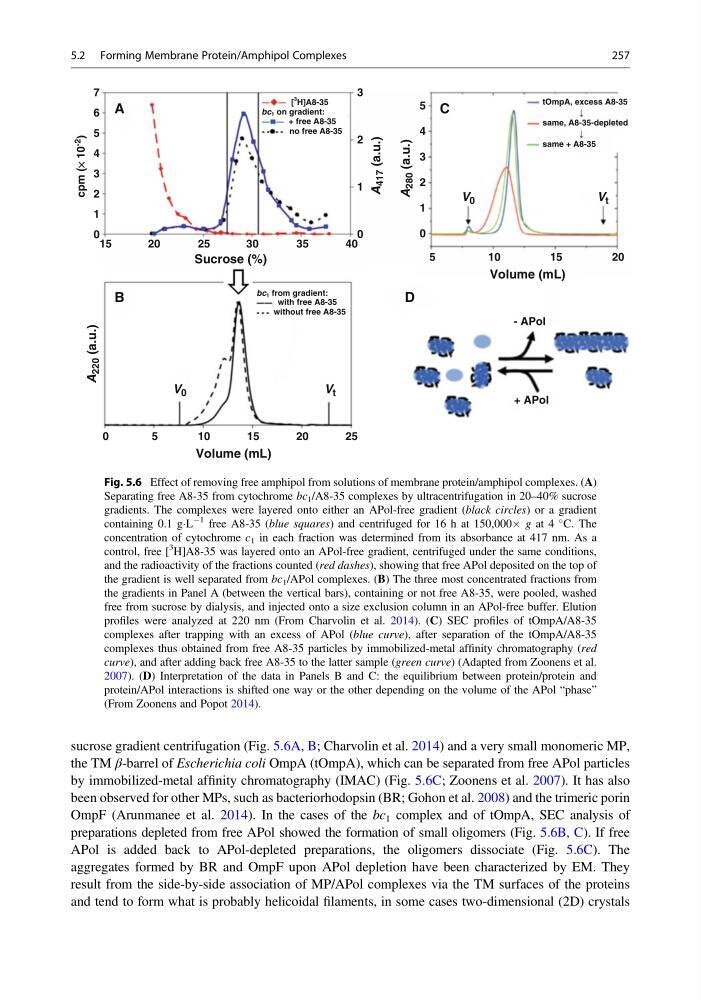
sucrose gradient centrifugation (Fig. 5.6A, B; Charvolin et al. 2014) and a very small monomeric MP,
the TM β-barrel of Escherichia coli OmpA (tOmpA), which can be separated from free APol particles
by immobilized-metal affinity chromatography (IMAC) (Fig. 5.6C; Zoonens et al. 2007). It has also
been observed for other MPs, such as bacteriorhodopsin (BR; Gohon et al. 2008) and the trimeric porin
OmpF (Arunmanee et al. 2014). In the cases of the bc 1 complex and of tOmpA, SEC analysis of
preparations depleted from free APol showed the formation of small oligomers (Fig. 5.6B, C). If free
APol is added back to APol-depleted preparations, the oligomers dissociate (Fig. 5.6C). The
aggregates formed by BR and OmpF upon APol depletion have been characterized by EM. They
result from the side-by-side association of MP/APol complexes via the TM surfaces of the proteins
and tend to form what is probably helicoidal filaments, in some cases two-dimensional (2D) crystals
15
15
20
10
5
0
0
1
2
no free A8-35
with free A8-35
without free A8-35
same + A8-35
same, A8-35-depleted
tOmpA, excess A8-35
- APol
+ APol
[
3
H]A8-35
bc1 on gradient:
bc1 from gradient:
+ free A8-35
3
0
1
1
2
2
3
3
cpm (¥ 10
-2
)
4
4
5
5
6
7
20
25
30
Sucrose (%)
Volume (mL)
V 0
V 0
V t
V t
A
417 (a.u.)
A
220 (a.u.)
A
280 (a.u.)
A
B
D
C
Volume (mL)
35
40
0
5
10
15
20
25
Fig. 5.6 Effect of removing free amphipol from solutions of membrane protein/amphipol complexes. (A)
Separating free A8-35 from cytochrome bc 1 /A8-35 complexes by ultracentrifugation in 20–40% sucrose
gradients. The complexes were layered onto either an APol-free gradient (black circles) or a gradient
containing 0.1 gÁL
À1 free A8-35 (blue squares) and centrifuged for 16 h at 150,000Â g at 4
C. The
concentration of cytochrome c 1 in each fraction was determined from its absorbance at 417 nm. As a
control, free [
3
H]A8-35 was layered onto an APol-free gradient, centrifuged under the same conditions,
and the radioactivity of the fractions counted (red dashes), showing that free APol deposited on the top of
the gradient is well separated from bc 1 /APol complexes. (B) The three most concentrated fractions from
the gradients in Panel A (between the vertical bars), containing or not free A8-35, were pooled, washed
free from sucrose by dialysis, and injected onto a size exclusion column in an APol-free buffer. Elution
profiles were analyzed at 220 nm (From Charvolin et al. 2014). (C) SEC profiles of tOmpA/A8-35
complexes after trapping with an excess of APol (blue curve), after separation of the tOmpA/A8-35
complexes thus obtained from free A8-35 particles by immobilized-metal affinity chromatography (red
curve), and after adding back free A8-35 to the latter sample (green curve) (Adapted from Zoonens et al.
2007). (D) Interpretation of the data in Panels B and C: the equilibrium between protein/protein and
protein/APol interactions is shifted one way or the other depending on the volume of the APol “phase”
(From Zoonens and Popot 2014).
5.2 Forming Membrane Protein/Amphipol Complexes
257
the TM β-barrel of Escherichia coli OmpA (tOmpA), which can be separated from free APol particles
by immobilized-metal affinity chromatography (IMAC) (Fig. 5.6C; Zoonens et al. 2007). It has also
been observed for other MPs, such as bacteriorhodopsin (BR; Gohon et al. 2008) and the trimeric porin
OmpF (Arunmanee et al. 2014). In the cases of the bc 1 complex and of tOmpA, SEC analysis of
preparations depleted from free APol showed the formation of small oligomers (Fig. 5.6B, C). If free
APol is added back to APol-depleted preparations, the oligomers dissociate (Fig. 5.6C). The
aggregates formed by BR and OmpF upon APol depletion have been characterized by EM. They
result from the side-by-side association of MP/APol complexes via the TM surfaces of the proteins
and tend to form what is probably helicoidal filaments, in some cases two-dimensional (2D) crystals
15
15
20
10
5
0
0
1
2
no free A8-35
with free A8-35
without free A8-35
same + A8-35
same, A8-35-depleted
tOmpA, excess A8-35
- APol
+ APol
[
3
H]A8-35
bc1 on gradient:
bc1 from gradient:
+ free A8-35
3
0
1
1
2
2
3
3
cpm (¥ 10
-2
)
4
4
5
5
6
7
20
25
30
Sucrose (%)
Volume (mL)
V 0
V 0
V t
V t
A
417 (a.u.)
A
220 (a.u.)
A
280 (a.u.)
A
B
D
C
Volume (mL)
35
40
0
5
10
15
20
25
Fig. 5.6 Effect of removing free amphipol from solutions of membrane protein/amphipol complexes. (A)
Separating free A8-35 from cytochrome bc 1 /A8-35 complexes by ultracentrifugation in 20–40% sucrose
gradients. The complexes were layered onto either an APol-free gradient (black circles) or a gradient
containing 0.1 gÁL
À1 free A8-35 (blue squares) and centrifuged for 16 h at 150,000Â g at 4
C. The
concentration of cytochrome c 1 in each fraction was determined from its absorbance at 417 nm. As a
control, free [
3
H]A8-35 was layered onto an APol-free gradient, centrifuged under the same conditions,
and the radioactivity of the fractions counted (red dashes), showing that free APol deposited on the top of
the gradient is well separated from bc 1 /APol complexes. (B) The three most concentrated fractions from
the gradients in Panel A (between the vertical bars), containing or not free A8-35, were pooled, washed
free from sucrose by dialysis, and injected onto a size exclusion column in an APol-free buffer. Elution
profiles were analyzed at 220 nm (From Charvolin et al. 2014). (C) SEC profiles of tOmpA/A8-35
complexes after trapping with an excess of APol (blue curve), after separation of the tOmpA/A8-35
complexes thus obtained from free A8-35 particles by immobilized-metal affinity chromatography (red
curve), and after adding back free A8-35 to the latter sample (green curve) (Adapted from Zoonens et al.
2007). (D) Interpretation of the data in Panels B and C: the equilibrium between protein/protein and
protein/APol interactions is shifted one way or the other depending on the volume of the APol “phase”
(From Zoonens and Popot 2014).
5.2 Forming Membrane Protein/Amphipol Complexes
257