

4.6.4
Annex 4.4. How to Control the Size of Polymers Obtained by Radical
Polymerization?
There are two main approaches to reducing size dispersity, telomerization (chain transfer) and controlled/living radical
polymerization (CRP).
4.6.4.1 Telomerization (Chain Transfer)
Telomerization has been widely used as a versatile tool to generate short polymers with 1.5 Đ 2 (Starks 1974; Farina
1987). It has largely come out of use since CRP methods proved to be more reliable. The concept is based on controlling
the transfer phenomena that occur concomitantly with radical propagation and impact polymer size, as described in
Annex 4.1 (cf. Fig. 4.38). The impact of transfer reactions on the final size distribution can be best understood by
referring to λ (Annex 4.3, Eq. 4.20), which can also be expressed as follows (Mayo 1943):
1
λ
¼
R in þ
P
i R tri
R p
¼
1
λ 0
þ
X
i
C Ti
TA i
ð
Þ
M
ð Þ
ð4:24Þ
where C tri ¼ k tri /k p is the transfer constant C tr of species i to the macroradical in formation, whose concentration is
[TA i ]. k tri and k p are the kinetic rate constants of transfer and propagation, respectively (see § 4.6.2, Annex 4.2).
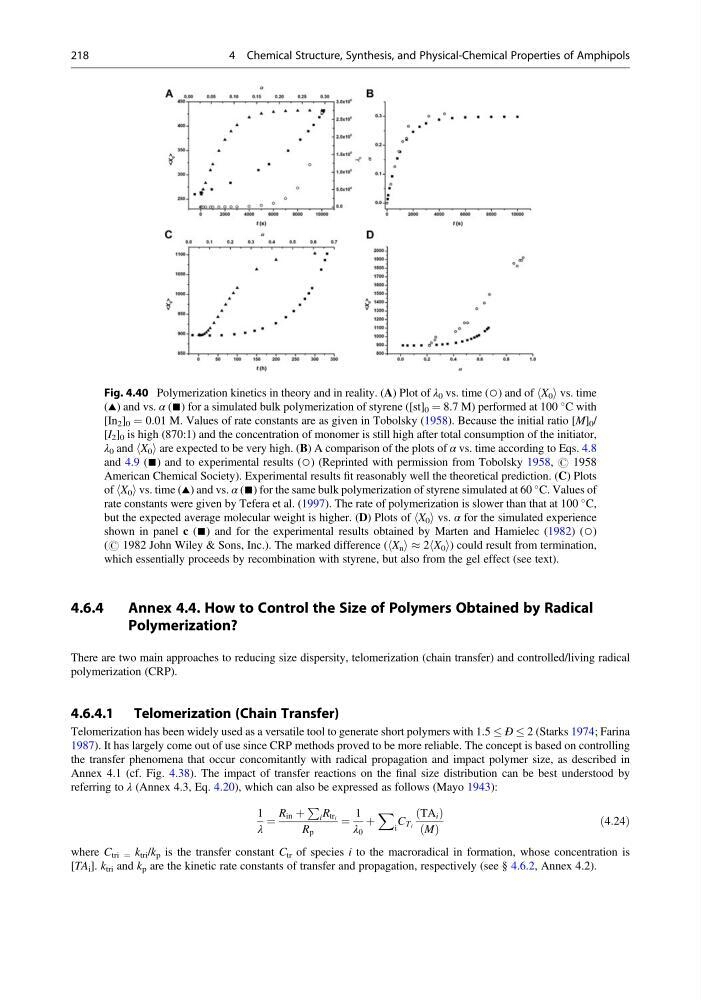
Fig. 4.40 Polymerization kinetics in theory and in reality. (A) Plot of λ 0 vs. time (○) and of hX 0 i vs. time
(~) and vs. α (■) for a simulated bulk polymerization of styrene ([st] 0 ¼ 8.7 M) performed at 100
C with
[In 2 ] 0 ¼ 0.01 M. Values of rate constants are as given in Tobolsky (1958). Because the initial ratio [M] 0 /
[I 2 ] 0 is high (870:1) and the concentration of monomer is still high after total consumption of the initiator,
λ 0 and hX 0 i are expected to be very high. (B) A comparison of the plots of α vs. time according to Eqs. 4.8
and 4.9 (■) and to experimental results (○) (Reprinted with permission from Tobolsky 1958, # 1958
American Chemical Society). Experimental results fit reasonably well the theoretical prediction. (C) Plots
of hX 0 i vs. time (~) and vs. α (■) for the same bulk polymerization of styrene simulated at 60
C. Values of
rate constants were given by Tefera et al. (1997). The rate of polymerization is slower than that at 100
C,
but the expected average molecular weight is higher. (D) Plots of hX 0 i vs. α for the simulated experience
shown in panel c (■) and for the experimental results obtained by Marten and Hamielec (1982) (○)
(# 1982 John Wiley & Sons, Inc.). The marked difference (hX n i % 2hX 0 i) could result from termination,
which essentially proceeds by recombination with styrene, but also from the gel effect (see text).
218
4 Chemical Structure, Synthesis, and Physical-Chemical Properties of Amphipols
Annex 4.4. How to Control the Size of Polymers Obtained by Radical
Polymerization?
There are two main approaches to reducing size dispersity, telomerization (chain transfer) and controlled/living radical
polymerization (CRP).
4.6.4.1 Telomerization (Chain Transfer)
Telomerization has been widely used as a versatile tool to generate short polymers with 1.5 Đ 2 (Starks 1974; Farina
1987). It has largely come out of use since CRP methods proved to be more reliable. The concept is based on controlling
the transfer phenomena that occur concomitantly with radical propagation and impact polymer size, as described in
Annex 4.1 (cf. Fig. 4.38). The impact of transfer reactions on the final size distribution can be best understood by
referring to λ (Annex 4.3, Eq. 4.20), which can also be expressed as follows (Mayo 1943):
1
λ
¼
R in þ
P
i R tri
R p
¼
1
λ 0
þ
X
i
C Ti
TA i
ð
Þ
M
ð Þ
ð4:24Þ
where C tri ¼ k tri /k p is the transfer constant C tr of species i to the macroradical in formation, whose concentration is
[TA i ]. k tri and k p are the kinetic rate constants of transfer and propagation, respectively (see § 4.6.2, Annex 4.2).
Fig. 4.40 Polymerization kinetics in theory and in reality. (A) Plot of λ 0 vs. time (○) and of hX 0 i vs. time
(~) and vs. α (■) for a simulated bulk polymerization of styrene ([st] 0 ¼ 8.7 M) performed at 100
C with
[In 2 ] 0 ¼ 0.01 M. Values of rate constants are as given in Tobolsky (1958). Because the initial ratio [M] 0 /
[I 2 ] 0 is high (870:1) and the concentration of monomer is still high after total consumption of the initiator,
λ 0 and hX 0 i are expected to be very high. (B) A comparison of the plots of α vs. time according to Eqs. 4.8
and 4.9 (■) and to experimental results (○) (Reprinted with permission from Tobolsky 1958, # 1958
American Chemical Society). Experimental results fit reasonably well the theoretical prediction. (C) Plots
of hX 0 i vs. time (~) and vs. α (■) for the same bulk polymerization of styrene simulated at 60
C. Values of
rate constants were given by Tefera et al. (1997). The rate of polymerization is slower than that at 100
C,
but the expected average molecular weight is higher. (D) Plots of hX 0 i vs. α for the simulated experience
shown in panel c (■) and for the experimental results obtained by Marten and Hamielec (1982) (○)
(# 1982 John Wiley & Sons, Inc.). The marked difference (hX n i % 2hX 0 i) could result from termination,
which essentially proceeds by recombination with styrene, but also from the gel effect (see text).
218
4 Chemical Structure, Synthesis, and Physical-Chemical Properties of Amphipols