

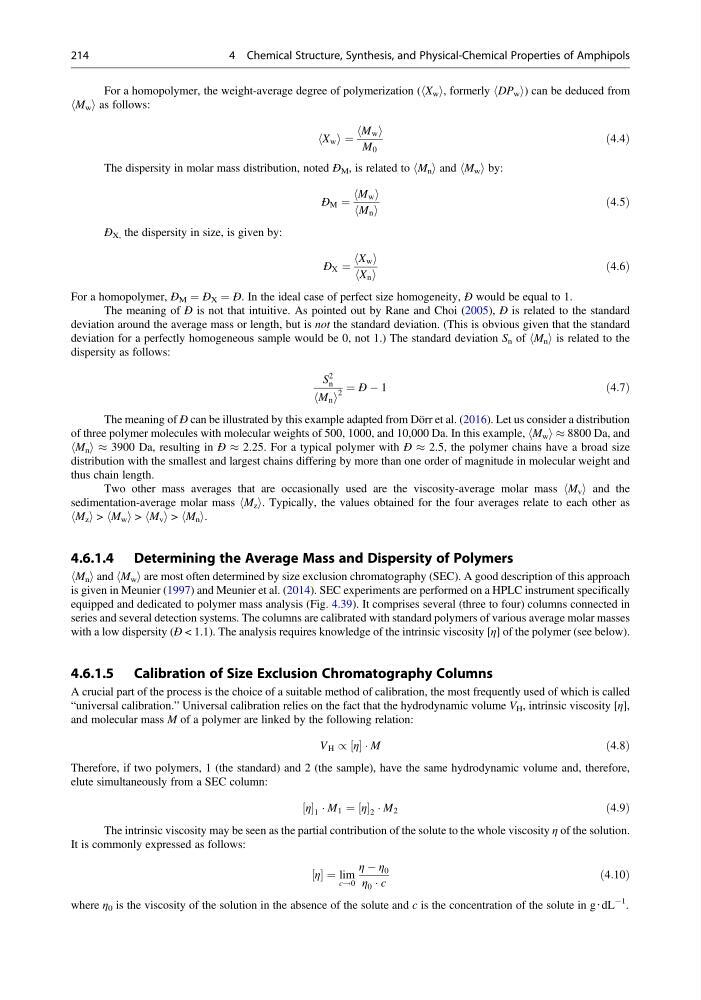
For a homopolymer, the weight-average degree of polymerization (hX w i, formerly hDP w i) can be deduced from
hM w i as follows:
X w
h i ¼
M w
h i
M 0
ð4:4Þ
The dispersity in molar mass distribution, noted Ð M , is related to hM n i and hM w i by:
Ð M ¼
M w
h i
M n
h i
ð4:5Þ
Ð X, the dispersity in size, is given by:
Ð X ¼
X w
h i
X n
h i
ð4:6Þ
For a homopolymer, Ð M ¼ Ð X ¼ Ð. In the ideal case of perfect size homogeneity, Ð would be equal to 1.
The meaning of Ð is not that intuitive. As pointed out by Rane and Choi (2005), Ð is related to the standard
deviation around the average mass or length, but is not the standard deviation. (This is obvious given that the standard
deviation for a perfectly homogeneous sample would be 0, not 1.) The standard deviation S n of hM n i is related to the
dispersity as follows:
S
2
n
M n
h i
2
¼ Ð À 1
ð4:7Þ
The meaning of Ð can be illustrated by this example adapted from Dörr et al. (2016). Let us consider a distribution
of three polymer molecules with molecular weights of 500, 1000, and 10,000 Da. In this example, hM w i % 8800 Da, and
hM n i % 3900 Da, resulting in Ð % 2.25. For a typical polymer with Ð % 2.5, the polymer chains have a broad size
distribution with the smallest and largest chains differing by more than one order of magnitude in molecular weight and
thus chain length.
Two other mass averages that are occasionally used are the viscosity-average molar mass hM v i and the
sedimentation-average molar mass hM z i. Typically, the values obtained for the four averages relate to each other as
hM z i > hM w i > hM v i > hM n i.
4.6.1.4 Determining the Average Mass and Dispersity of Polymers
hM n i and hM w i are most often determined by size exclusion chromatography (SEC). A good description of this approach
is given in Meunier (1997) and Meunier et al. (2014). SEC experiments are performed on a HPLC instrument specifically
equipped and dedicated to polymer mass analysis (Fig. 4.39). It comprises several (three to four) columns connected in
series and several detection systems. The columns are calibrated with standard polymers of various average molar masses
with a low dispersity (Ð < 1.1). The analysis requires knowledge of the intrinsic viscosity [η] of the polymer (see below).
4.6.1.5 Calibration of Size Exclusion Chromatography Columns
A crucial part of the process is the choice of a suitable method of calibration, the most frequently used of which is called
“universal calibration.” Universal calibration relies on the fact that the hydrodynamic volume V H , intrinsic viscosity [η],
and molecular mass M of a polymer are linked by the following relation:
V H / η
½ Á M
ð4:8Þ
Therefore, if two polymers, 1 (the standard) and 2 (the sample), have the same hydrodynamic volume and, therefore,
elute simultaneously from a SEC column:
η
½ 1 Á M 1 ¼ η
½ 2 Á M 2
ð4:9Þ
The intrinsic viscosity may be seen as the partial contribution of the solute to the whole viscosity η of the solution.
It is commonly expressed as follows:
η
½ ¼ lim
c!0
η À η 0
η 0 Á c
ð4:10Þ
where η 0 is the viscosity of the solution in the absence of the solute and c is the concentration of the solute in g‧dL
À1
.
214
4 Chemical Structure, Synthesis, and Physical-Chemical Properties of Amphipols
hM w i as follows:
X w
h i ¼
M w
h i
M 0
ð4:4Þ
The dispersity in molar mass distribution, noted Ð M , is related to hM n i and hM w i by:
Ð M ¼
M w
h i
M n
h i
ð4:5Þ
Ð X, the dispersity in size, is given by:
Ð X ¼
X w
h i
X n
h i
ð4:6Þ
For a homopolymer, Ð M ¼ Ð X ¼ Ð. In the ideal case of perfect size homogeneity, Ð would be equal to 1.
The meaning of Ð is not that intuitive. As pointed out by Rane and Choi (2005), Ð is related to the standard
deviation around the average mass or length, but is not the standard deviation. (This is obvious given that the standard
deviation for a perfectly homogeneous sample would be 0, not 1.) The standard deviation S n of hM n i is related to the
dispersity as follows:
S
2
n
M n
h i
2
¼ Ð À 1
ð4:7Þ
The meaning of Ð can be illustrated by this example adapted from Dörr et al. (2016). Let us consider a distribution
of three polymer molecules with molecular weights of 500, 1000, and 10,000 Da. In this example, hM w i % 8800 Da, and
hM n i % 3900 Da, resulting in Ð % 2.25. For a typical polymer with Ð % 2.5, the polymer chains have a broad size
distribution with the smallest and largest chains differing by more than one order of magnitude in molecular weight and
thus chain length.
Two other mass averages that are occasionally used are the viscosity-average molar mass hM v i and the
sedimentation-average molar mass hM z i. Typically, the values obtained for the four averages relate to each other as
hM z i > hM w i > hM v i > hM n i.
4.6.1.4 Determining the Average Mass and Dispersity of Polymers
hM n i and hM w i are most often determined by size exclusion chromatography (SEC). A good description of this approach
is given in Meunier (1997) and Meunier et al. (2014). SEC experiments are performed on a HPLC instrument specifically
equipped and dedicated to polymer mass analysis (Fig. 4.39). It comprises several (three to four) columns connected in
series and several detection systems. The columns are calibrated with standard polymers of various average molar masses
with a low dispersity (Ð < 1.1). The analysis requires knowledge of the intrinsic viscosity [η] of the polymer (see below).
4.6.1.5 Calibration of Size Exclusion Chromatography Columns
A crucial part of the process is the choice of a suitable method of calibration, the most frequently used of which is called
“universal calibration.” Universal calibration relies on the fact that the hydrodynamic volume V H , intrinsic viscosity [η],
and molecular mass M of a polymer are linked by the following relation:
V H / η
½ Á M
ð4:8Þ
Therefore, if two polymers, 1 (the standard) and 2 (the sample), have the same hydrodynamic volume and, therefore,
elute simultaneously from a SEC column:
η
½ 1 Á M 1 ¼ η
½ 2 Á M 2
ð4:9Þ
The intrinsic viscosity may be seen as the partial contribution of the solute to the whole viscosity η of the solution.
It is commonly expressed as follows:
η
½ ¼ lim
c!0
η À η 0
η 0 Á c
ð4:10Þ
where η 0 is the viscosity of the solution in the absence of the solute and c is the concentration of the solute in g‧dL
À1
.
214
4 Chemical Structure, Synthesis, and Physical-Chemical Properties of Amphipols