

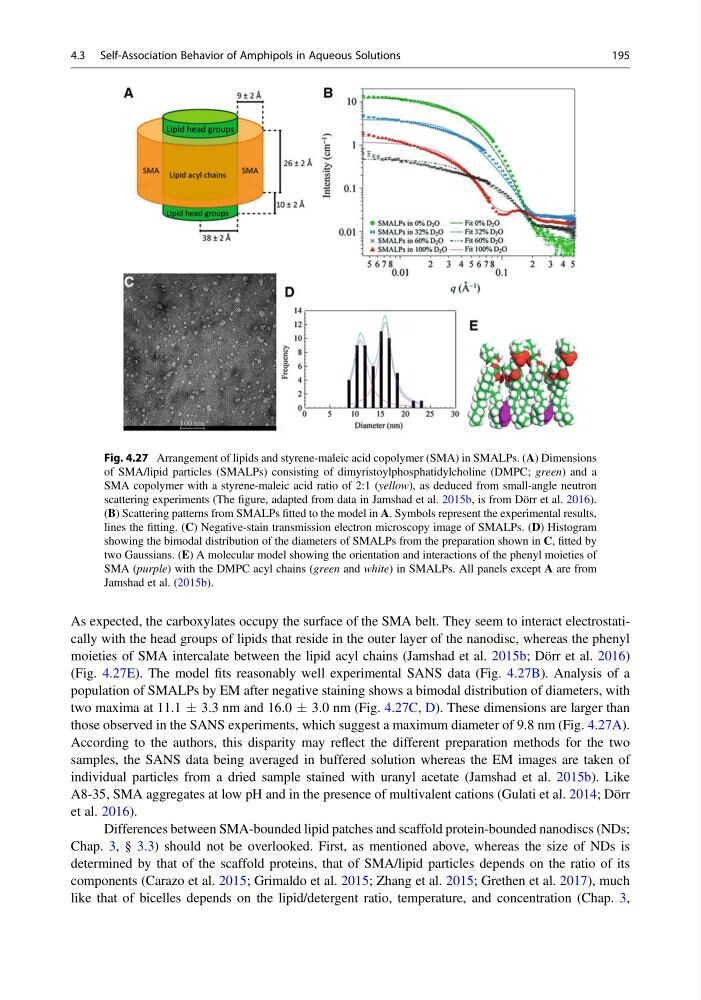
As expected, the carboxylates occupy the surface of the SMA belt. They seem to interact electrostatically with the head groups of lipids that reside in the outer layer of the nanodisc, whereas the phenyl
moieties of SMA intercalate between the lipid acyl chains (Jamshad et al. 2015b; Dörr et al. 2016)
(Fig. 4.27E). The model fits reasonably well experimental SANS data (Fig. 4.27B). Analysis of a
population of SMALPs by EM after negative staining shows a bimodal distribution of diameters, with
two maxima at 11.1 Æ 3.3 nm and 16.0 Æ 3.0 nm (Fig. 4.27C, D). These dimensions are larger than
those observed in the SANS experiments, which suggest a maximum diameter of 9.8 nm (Fig. 4.27A).
According to the authors, this disparity may reflect the different preparation methods for the two
samples, the SANS data being averaged in buffered solution whereas the EM images are taken of
individual particles from a dried sample stained with uranyl acetate (Jamshad et al. 2015b). Like
A8-35, SMA aggregates at low pH and in the presence of multivalent cations (Gulati et al. 2014; Dörr
et al. 2016).
Differences between SMA-bounded lipid patches and scaffold protein-bounded nanodiscs (NDs;
Chap. 3, § 3.3) should not be overlooked. First, as mentioned above, whereas the size of NDs is
determined by that of the scaffold proteins, that of SMA/lipid particles depends on the ratio of its
components (Carazo et al. 2015; Grimaldo et al. 2015; Zhang et al. 2015; Grethen et al. 2017), much
like that of bicelles depends on the lipid/detergent ratio, temperature, and concentration (Chap. 3,
Fig. 4.27 Arrangement of lipids and styrene-maleic acid copolymer (SMA) in SMALPs. (A) Dimensions
of SMA/lipid particles (SMALPs) consisting of dimyristoylphosphatidylcholine (DMPC; green) and a
SMA copolymer with a styrene-maleic acid ratio of 2:1 (yellow), as deduced from small-angle neutron
scattering experiments (The figure, adapted from data in Jamshad et al. 2015b, is from Dörr et al. 2016).
(B) Scattering patterns from SMALPs fitted to the model in A. Symbols represent the experimental results,
lines the fitting. (C) Negative-stain transmission electron microscopy image of SMALPs. (D) Histogram
showing the bimodal distribution of the diameters of SMALPs from the preparation shown in C, fitted by
two Gaussians. (E) A molecular model showing the orientation and interactions of the phenyl moieties of
SMA (purple) with the DMPC acyl chains (green and white) in SMALPs. All panels except A are from
Jamshad et al. (2015b).
4.3 Self-Association Behavior of Amphipols in Aqueous Solutions
195
moieties of SMA intercalate between the lipid acyl chains (Jamshad et al. 2015b; Dörr et al. 2016)
(Fig. 4.27E). The model fits reasonably well experimental SANS data (Fig. 4.27B). Analysis of a
population of SMALPs by EM after negative staining shows a bimodal distribution of diameters, with
two maxima at 11.1 Æ 3.3 nm and 16.0 Æ 3.0 nm (Fig. 4.27C, D). These dimensions are larger than
those observed in the SANS experiments, which suggest a maximum diameter of 9.8 nm (Fig. 4.27A).
According to the authors, this disparity may reflect the different preparation methods for the two
samples, the SANS data being averaged in buffered solution whereas the EM images are taken of
individual particles from a dried sample stained with uranyl acetate (Jamshad et al. 2015b). Like
A8-35, SMA aggregates at low pH and in the presence of multivalent cations (Gulati et al. 2014; Dörr
et al. 2016).
Differences between SMA-bounded lipid patches and scaffold protein-bounded nanodiscs (NDs;
Chap. 3, § 3.3) should not be overlooked. First, as mentioned above, whereas the size of NDs is
determined by that of the scaffold proteins, that of SMA/lipid particles depends on the ratio of its
components (Carazo et al. 2015; Grimaldo et al. 2015; Zhang et al. 2015; Grethen et al. 2017), much
like that of bicelles depends on the lipid/detergent ratio, temperature, and concentration (Chap. 3,
Fig. 4.27 Arrangement of lipids and styrene-maleic acid copolymer (SMA) in SMALPs. (A) Dimensions
of SMA/lipid particles (SMALPs) consisting of dimyristoylphosphatidylcholine (DMPC; green) and a
SMA copolymer with a styrene-maleic acid ratio of 2:1 (yellow), as deduced from small-angle neutron
scattering experiments (The figure, adapted from data in Jamshad et al. 2015b, is from Dörr et al. 2016).
(B) Scattering patterns from SMALPs fitted to the model in A. Symbols represent the experimental results,
lines the fitting. (C) Negative-stain transmission electron microscopy image of SMALPs. (D) Histogram
showing the bimodal distribution of the diameters of SMALPs from the preparation shown in C, fitted by
two Gaussians. (E) A molecular model showing the orientation and interactions of the phenyl moieties of
SMA (purple) with the DMPC acyl chains (green and white) in SMALPs. All panels except A are from
Jamshad et al. (2015b).
4.3 Self-Association Behavior of Amphipols in Aqueous Solutions
195