

§ 3.2). Second, phase transition and Raman spectroscopy studies (Orwick et al. 2012; Jamshad et al.
2015b; Tanaka et al. 2015; Oluwole et al. 2017) indicate that the lipid bilayer is more perturbed than it
is in NDs, suggesting some degree of mixing between the polymer and the lipids (cf. Fig. 4.27E).
Third, the lipid content of the various particles in a preparation is not segregated. It exchanges within
seconds, with kinetics consistent with the occurrence of lateral fusion and fission events (Cuevas
Arenas et al. 2017; Grethen et al. 2018). This observation suggests that SMALPs, at variance with
NDs, do not prevent MPs nor lipids supposedly isolated in distinct patches from interacting one with
another (which, depending on the experiments contemplated, can be either a useful feature or a
nuisance). Preferential association of specific lipids with MPs extracted in SMALPs (see Dominguez
Pardo et al. 2017 and references therein) thus must betray an equilibrium situation, rather than a
kinetically frozen one (Cuevas Arenas et al. 2017). By the same token, it seems unlikely that SMALPs
preserve the compositional asymmetry of the biological membranes the patches were extracted from.
Homotelomeric glucose-based non-ionic APols (NAPols) are highly soluble in water. Their
solutions are transparent and remain fluid up to a concentration of 100 gÁL
À1 , above which their
viscosity increases. NAPol particles have been studied by DLS, SEC, AUC, SANS, and densitometry
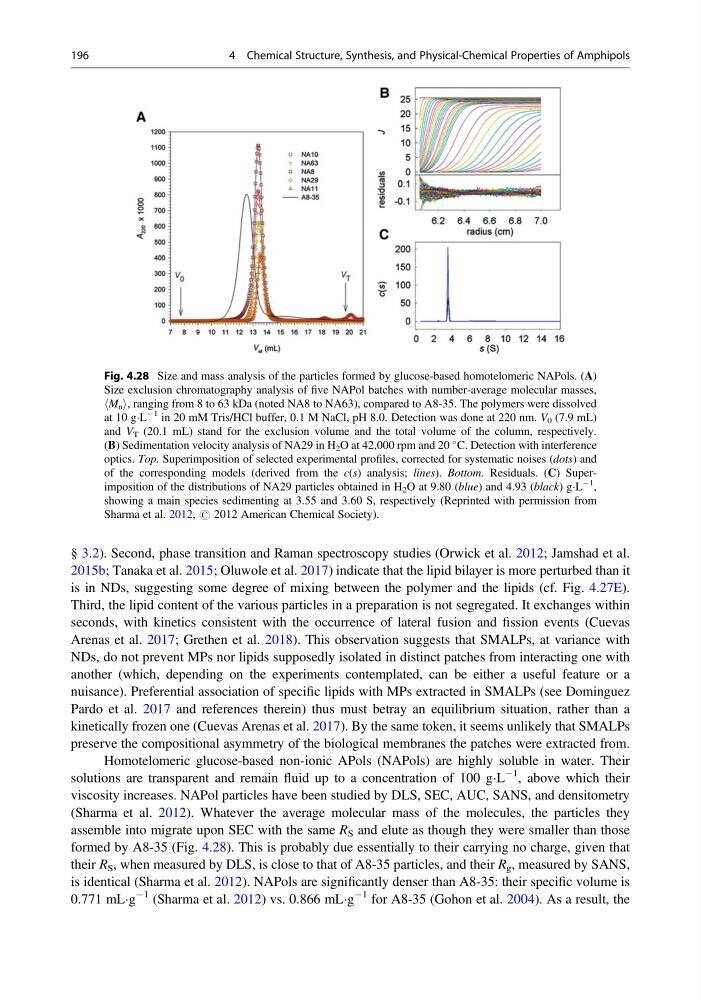
(Sharma et al. 2012). Whatever the average molecular mass of the molecules, the particles they
assemble into migrate upon SEC with the same R S and elute as though they were smaller than those
formed by A8-35 (Fig. 4.28). This is probably due essentially to their carrying no charge, given that
their R S , when measured by DLS, is close to that of A8-35 particles, and their R g , measured by SANS,
is identical (Sharma et al. 2012). NAPols are significantly denser than A8-35: their specific volume is
0.771 mLÁg
À1 (Sharma et al. 2012) vs. 0.866 mLÁg
À1 for A8-35 (Gohon et al. 2004). As a result, the
Fig. 4.28 Size and mass analysis of the particles formed by glucose-based homotelomeric NAPols. (A)
Size exclusion chromatography analysis of five NAPol batches with number-average molecular masses,
hM n i, ranging from 8 to 63 kDa (noted NA8 to NA63), compared to A8-35. The polymers were dissolved
at 10 gÁL
À1 in 20 mM Tris/HCl buffer, 0.1 M NaCl, pH 8.0. Detection was done at 220 nm. V 0 (7.9 mL)
and V T (20.1 mL) stand for the exclusion volume and the total volume of the column, respectively.
(B) Sedimentation velocity analysis of NA29 in H 2 O at 42,000 rpm and 20
C. Detection with interference
optics. Top. Superimposition of selected experimental profiles, corrected for systematic noises (dots) and
of the corresponding models (derived from the c(s) analysis; lines). Bottom. Residuals. (C) Superimposition of the distributions of NA29 particles obtained in H 2 O at 9.80 (blue) and 4.93 (black) gÁL
À1
,
showing a main species sedimenting at 3.55 and 3.60 S, respectively (Reprinted with permission from
Sharma et al. 2012, # 2012 American Chemical Society).
196
4 Chemical Structure, Synthesis, and Physical-Chemical Properties of Amphipols
2015b; Tanaka et al. 2015; Oluwole et al. 2017) indicate that the lipid bilayer is more perturbed than it
is in NDs, suggesting some degree of mixing between the polymer and the lipids (cf. Fig. 4.27E).
Third, the lipid content of the various particles in a preparation is not segregated. It exchanges within
seconds, with kinetics consistent with the occurrence of lateral fusion and fission events (Cuevas
Arenas et al. 2017; Grethen et al. 2018). This observation suggests that SMALPs, at variance with
NDs, do not prevent MPs nor lipids supposedly isolated in distinct patches from interacting one with
another (which, depending on the experiments contemplated, can be either a useful feature or a
nuisance). Preferential association of specific lipids with MPs extracted in SMALPs (see Dominguez
Pardo et al. 2017 and references therein) thus must betray an equilibrium situation, rather than a
kinetically frozen one (Cuevas Arenas et al. 2017). By the same token, it seems unlikely that SMALPs
preserve the compositional asymmetry of the biological membranes the patches were extracted from.
Homotelomeric glucose-based non-ionic APols (NAPols) are highly soluble in water. Their
solutions are transparent and remain fluid up to a concentration of 100 gÁL
À1 , above which their
viscosity increases. NAPol particles have been studied by DLS, SEC, AUC, SANS, and densitometry
(Sharma et al. 2012). Whatever the average molecular mass of the molecules, the particles they
assemble into migrate upon SEC with the same R S and elute as though they were smaller than those
formed by A8-35 (Fig. 4.28). This is probably due essentially to their carrying no charge, given that
their R S , when measured by DLS, is close to that of A8-35 particles, and their R g , measured by SANS,
is identical (Sharma et al. 2012). NAPols are significantly denser than A8-35: their specific volume is
0.771 mLÁg
À1 (Sharma et al. 2012) vs. 0.866 mLÁg
À1 for A8-35 (Gohon et al. 2004). As a result, the
Fig. 4.28 Size and mass analysis of the particles formed by glucose-based homotelomeric NAPols. (A)
Size exclusion chromatography analysis of five NAPol batches with number-average molecular masses,
hM n i, ranging from 8 to 63 kDa (noted NA8 to NA63), compared to A8-35. The polymers were dissolved
at 10 gÁL
À1 in 20 mM Tris/HCl buffer, 0.1 M NaCl, pH 8.0. Detection was done at 220 nm. V 0 (7.9 mL)
and V T (20.1 mL) stand for the exclusion volume and the total volume of the column, respectively.
(B) Sedimentation velocity analysis of NA29 in H 2 O at 42,000 rpm and 20
C. Detection with interference
optics. Top. Superimposition of selected experimental profiles, corrected for systematic noises (dots) and
of the corresponding models (derived from the c(s) analysis; lines). Bottom. Residuals. (C) Superimposition of the distributions of NA29 particles obtained in H 2 O at 9.80 (blue) and 4.93 (black) gÁL
À1
,
showing a main species sedimenting at 3.55 and 3.60 S, respectively (Reprinted with permission from
Sharma et al. 2012, # 2012 American Chemical Society).
196
4 Chemical Structure, Synthesis, and Physical-Chemical Properties of Amphipols