

between particles and individual A8-35 molecules. Indeed, at this concentration, which is ~100Â
above the CAC, ~99% of A8-35 is associated into particles and only ~1% present as free molecules.
Taking the particles to comprise n molecules, where n % 9, their molar concentration is therefore ~
(100/n)Â that of the free molecules. MD simulations predict that free molecules collapse upon
themselves (Fig. 4.18), so their overall shape can be expected not to be too different from that of the
particles. Given that, for homothetic particles, D t is proportional to M
À1/3 , free A8-35 molecules can
be expected to diffuse only ~1.6Â more rapidly than particles. Particles therefore must experience
collisions with other particles ~(100/1.6 n) Â more often than collisions with free molecules. Because
the former comprise n molecules rather than one, particle-mediated exchange is likely to be ~100/
1.6 ¼ 60Â more efficient than that mediated by single molecules. This difference will become even
more pronounced at the more usual concentrations of several gÁL
À1 .
The rate of adsorption of A8-35 at the air/water interface, examined by dynamic surface tension
(DST) measurements using the maximum pressure bubble method (Fainerman et al. 1994; Miller et al.
1994), was found to be rapid (seconds) at concentrations >1 gÁL
À1 (Giusti et al. 2012) (Fig. 4.25).
Below this threshold, it decreases markedly with decreasing polymer concentration. As discussed in
0
0
0.01
0.1
1
10
2
4
6
Lag Time (ns)
Time (ns)
Mean Square Displacement (nm
2
)
0.01
0.1
1
10
Mean Square Displacement (nm
2
)
8
1 0
2
4
6
POPC Ester Oxygen
SDS Sulfur
AAMD Backbone
rCG Backbone
POPC Terminal
SDS Terminal
AAMD Terminal
rCG Terminal
8
1 0
Time (ns)
2
4
6
8
1 0
12
0.5
A
B
C
1
Backbone CH2
Backbone CH
Iso Sidechain CH
Iso Sidechain CH 3
Oct Sidechain CH3
Oct Sidechain CH2
Autocorrelation
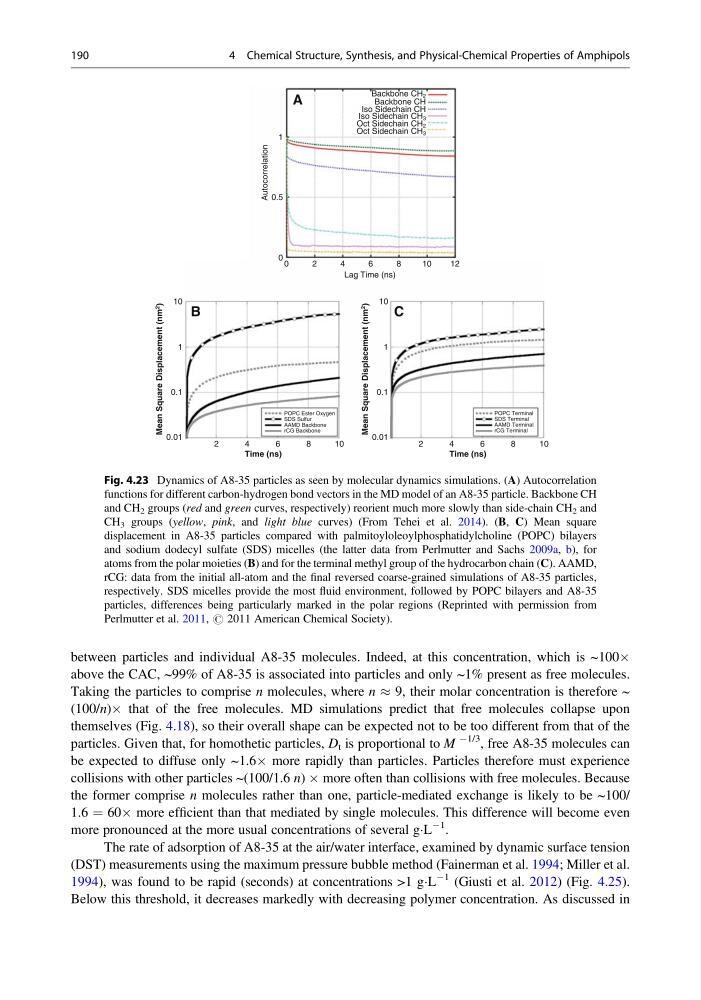
Fig. 4.23 Dynamics of A8-35 particles as seen by molecular dynamics simulations. (A) Autocorrelation
functions for different carbon-hydrogen bond vectors in the MD model of an A8-35 particle. Backbone CH
and CH 2 groups (red and green curves, respectively) reorient much more slowly than side-chain CH 2 and
CH 3 groups (yellow, pink, and light blue curves) (From Tehei et al. 2014). (B, C) Mean square
displacement in A8-35 particles compared with palmitoyloleoylphosphatidylcholine (POPC) bilayers
and sodium dodecyl sulfate (SDS) micelles (the latter data from Perlmutter and Sachs 2009a, b), for
atoms from the polar moieties (B) and for the terminal methyl group of the hydrocarbon chain (C). AAMD,
rCG: data from the initial all-atom and the final reversed coarse-grained simulations of A8-35 particles,
respectively. SDS micelles provide the most fluid environment, followed by POPC bilayers and A8-35
particles, differences being particularly marked in the polar regions (Reprinted with permission from
Perlmutter et al. 2011, # 2011 American Chemical Society).
190
4 Chemical Structure, Synthesis, and Physical-Chemical Properties of Amphipols
above the CAC, ~99% of A8-35 is associated into particles and only ~1% present as free molecules.
Taking the particles to comprise n molecules, where n % 9, their molar concentration is therefore ~
(100/n)Â that of the free molecules. MD simulations predict that free molecules collapse upon
themselves (Fig. 4.18), so their overall shape can be expected not to be too different from that of the
particles. Given that, for homothetic particles, D t is proportional to M
À1/3 , free A8-35 molecules can
be expected to diffuse only ~1.6Â more rapidly than particles. Particles therefore must experience
collisions with other particles ~(100/1.6 n) Â more often than collisions with free molecules. Because
the former comprise n molecules rather than one, particle-mediated exchange is likely to be ~100/
1.6 ¼ 60Â more efficient than that mediated by single molecules. This difference will become even
more pronounced at the more usual concentrations of several gÁL
À1 .
The rate of adsorption of A8-35 at the air/water interface, examined by dynamic surface tension
(DST) measurements using the maximum pressure bubble method (Fainerman et al. 1994; Miller et al.
1994), was found to be rapid (seconds) at concentrations >1 gÁL
À1 (Giusti et al. 2012) (Fig. 4.25).
Below this threshold, it decreases markedly with decreasing polymer concentration. As discussed in
0
0
0.01
0.1
1
10
2
4
6
Lag Time (ns)
Time (ns)
Mean Square Displacement (nm
2
)
0.01
0.1
1
10
Mean Square Displacement (nm
2
)
8
1 0
2
4
6
POPC Ester Oxygen
SDS Sulfur
AAMD Backbone
rCG Backbone
POPC Terminal
SDS Terminal
AAMD Terminal
rCG Terminal
8
1 0
Time (ns)
2
4
6
8
1 0
12
0.5
A
B
C
1
Backbone CH2
Backbone CH
Iso Sidechain CH
Iso Sidechain CH 3
Oct Sidechain CH3
Oct Sidechain CH2
Autocorrelation
Fig. 4.23 Dynamics of A8-35 particles as seen by molecular dynamics simulations. (A) Autocorrelation
functions for different carbon-hydrogen bond vectors in the MD model of an A8-35 particle. Backbone CH
and CH 2 groups (red and green curves, respectively) reorient much more slowly than side-chain CH 2 and
CH 3 groups (yellow, pink, and light blue curves) (From Tehei et al. 2014). (B, C) Mean square
displacement in A8-35 particles compared with palmitoyloleoylphosphatidylcholine (POPC) bilayers
and sodium dodecyl sulfate (SDS) micelles (the latter data from Perlmutter and Sachs 2009a, b), for
atoms from the polar moieties (B) and for the terminal methyl group of the hydrocarbon chain (C). AAMD,
rCG: data from the initial all-atom and the final reversed coarse-grained simulations of A8-35 particles,
respectively. SDS micelles provide the most fluid environment, followed by POPC bilayers and A8-35
particles, differences being particularly marked in the polar regions (Reprinted with permission from
Perlmutter et al. 2011, # 2011 American Chemical Society).
190
4 Chemical Structure, Synthesis, and Physical-Chemical Properties of Amphipols