

Translational Diffusion Coefficient
The translational diffusion coefficient of A8-35 particles can be deduced from QENS data on HAPol
measured on a backscattering spectrometer (0.9 μeV resolution, ~1-ns time scale). The QENS
spectrum is well fitted by a single Lorentzian, whose half-width at half-maximum, Γ, is plotted versus
Q
2 in Fig. 4.24. The linear dependence of Γ on Q
2 indicates that, on the time scale of ~1 ns,
macromolecular translation of the A8-35 particle as a whole dominates the QENS spectrum. A
translational diffusion coefficient D t ¼ (4.45 Æ 0.11) Â 10
–7 cm
2
Á s
À1 can be calculated from the plot.
The SV-AUC data in Gohon et al. (2006), obtained at 1–10 gÁL
À1 , yield a translational diffusion
coefficient at infinite dilution in water D 0 ¼ 6.8 Â 10
–7 cm
2
Ás
À1 . Correcting for the crowding and the
viscosity of the solutions used in the QENS experiments, this corresponds to an expected diffusion
coefficient at 240 gÁL
À1 in D 2 O of 4.16 Â 10
–7 cm
2
Ás
À1 , in fair agreement with the neutron scattering
experimental value of (4.45 Æ 0.11) Â 10
–7 cm
2
Ás
À1 (Tehei et al. 2014) (Fig. 4.24). This is an
important control, confirming that APol particles of similar properties to the ones characterized
previously are still present at the high concentration required for the QENS measurements. It is
quite remarkable that A8-35 particles remain essentially the same in the 1–10-gÁL
À1 range (Gohon
et al. 2006), at ~240 gÁL
À1 (Tehei et al. 2014), and presumably, given the stability of the normalized
FRET signal above the CAC (Fig. 4.10C), down to 0.002 gÁL
À1 (Giusti et al. 2012), that is, over five
orders of magnitude of concentration (see § 4.3.1.2.5).
Particle Interactions
Interactions between A8-35 particles have not been studied directly. However, the kinetics of exchange
of A8-35 molecules between the solution and belts of MP-associated A8-35 have been examined by
FRET (Zoonens et al. 2007). These experiments will be discussed below from the point of view of the
dynamics of MP/APol complexes (Chap. 5, § 5.6). Extrapolating from these data to interactions in pure
APol solutions, which seems reasonable, suggests that, at 0.2 gÁL
À1 and in the presence of 100 mM
NaCl, the content of the particles mixes within minutes, whereas it takes hours in the absence of salt,
consistent with a mechanism involving collisions between charged entities (Zoonens et al. 2007). A
simple reasoning suggests that these exchanges involve collisions between particles rather than
0.8
HAPol G 1
0.700
90 meV
50 meV
0.600
0.500
0.400
0.300
0.200
0.100
0.000
0.7
0.6
0.5
0.4
0.3
0.2
0.1
0.0
0.0
G (meV)
Q
2 (Å
-2 )
G (meV)
0.5
1.0
1.5
2.0
2.5
3.0
0.0
0.5
1.0
1.5
2.5
2.0
3.0
HAPol G 1
DAPol G
DAPol G
HAPol G 2
HAPol G 2
Q
2 (Å
-2 )
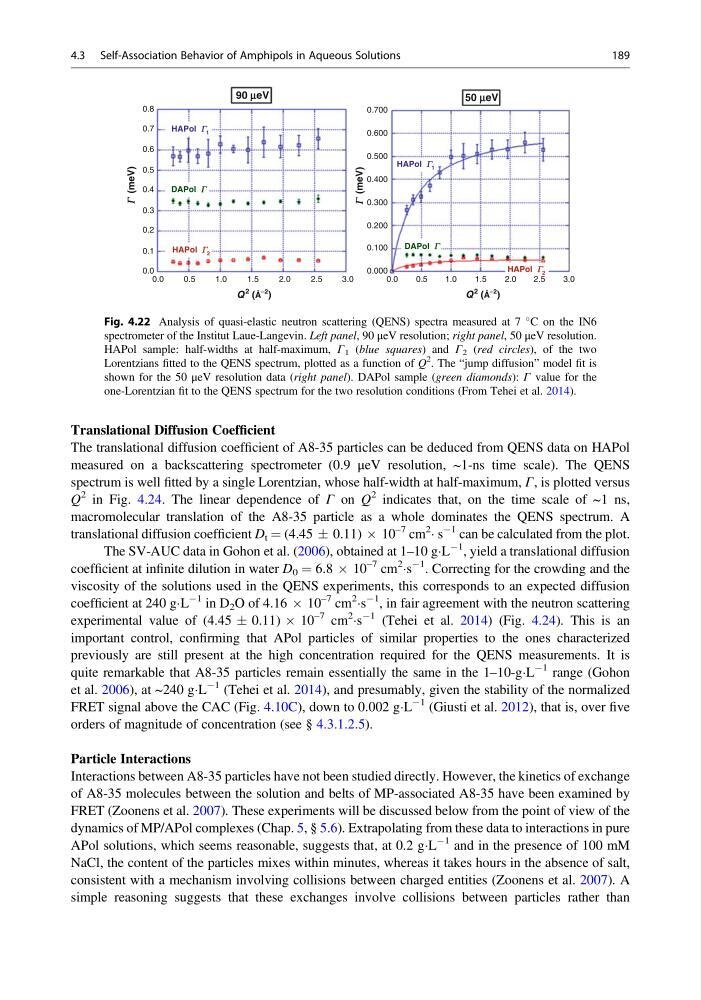
Fig. 4.22 Analysis of quasi-elastic neutron scattering (QENS) spectra measured at 7
C on the IN6
spectrometer of the Institut Laue-Langevin. Left panel, 90 μeV resolution; right panel, 50 μeV resolution.
HAPol sample: half-widths at half-maximum, Γ 1 (blue squares) and Γ 2 (red circles), of the two
Lorentzians fitted to the QENS spectrum, plotted as a function of Q
2
. The “jump diffusion” model fit is
shown for the 50 μeV resolution data (right panel). DAPol sample (green diamonds): Γ value for the
one-Lorentzian fit to the QENS spectrum for the two resolution conditions (From Tehei et al. 2014).
4.3 Self-Association Behavior of Amphipols in Aqueous Solutions
189
The translational diffusion coefficient of A8-35 particles can be deduced from QENS data on HAPol
measured on a backscattering spectrometer (0.9 μeV resolution, ~1-ns time scale). The QENS
spectrum is well fitted by a single Lorentzian, whose half-width at half-maximum, Γ, is plotted versus
Q
2 in Fig. 4.24. The linear dependence of Γ on Q
2 indicates that, on the time scale of ~1 ns,
macromolecular translation of the A8-35 particle as a whole dominates the QENS spectrum. A
translational diffusion coefficient D t ¼ (4.45 Æ 0.11) Â 10
–7 cm
2
Á s
À1 can be calculated from the plot.
The SV-AUC data in Gohon et al. (2006), obtained at 1–10 gÁL
À1 , yield a translational diffusion
coefficient at infinite dilution in water D 0 ¼ 6.8 Â 10
–7 cm
2
Ás
À1 . Correcting for the crowding and the
viscosity of the solutions used in the QENS experiments, this corresponds to an expected diffusion
coefficient at 240 gÁL
À1 in D 2 O of 4.16 Â 10
–7 cm
2
Ás
À1 , in fair agreement with the neutron scattering
experimental value of (4.45 Æ 0.11) Â 10
–7 cm
2
Ás
À1 (Tehei et al. 2014) (Fig. 4.24). This is an
important control, confirming that APol particles of similar properties to the ones characterized
previously are still present at the high concentration required for the QENS measurements. It is
quite remarkable that A8-35 particles remain essentially the same in the 1–10-gÁL
À1 range (Gohon
et al. 2006), at ~240 gÁL
À1 (Tehei et al. 2014), and presumably, given the stability of the normalized
FRET signal above the CAC (Fig. 4.10C), down to 0.002 gÁL
À1 (Giusti et al. 2012), that is, over five
orders of magnitude of concentration (see § 4.3.1.2.5).
Particle Interactions
Interactions between A8-35 particles have not been studied directly. However, the kinetics of exchange
of A8-35 molecules between the solution and belts of MP-associated A8-35 have been examined by
FRET (Zoonens et al. 2007). These experiments will be discussed below from the point of view of the
dynamics of MP/APol complexes (Chap. 5, § 5.6). Extrapolating from these data to interactions in pure
APol solutions, which seems reasonable, suggests that, at 0.2 gÁL
À1 and in the presence of 100 mM
NaCl, the content of the particles mixes within minutes, whereas it takes hours in the absence of salt,
consistent with a mechanism involving collisions between charged entities (Zoonens et al. 2007). A
simple reasoning suggests that these exchanges involve collisions between particles rather than
0.8
HAPol G 1
0.700
90 meV
50 meV
0.600
0.500
0.400
0.300
0.200
0.100
0.000
0.7
0.6
0.5
0.4
0.3
0.2
0.1
0.0
0.0
G (meV)
Q
2 (Å
-2 )
G (meV)
0.5
1.0
1.5
2.0
2.5
3.0
0.0
0.5
1.0
1.5
2.5
2.0
3.0
HAPol G 1
DAPol G
DAPol G
HAPol G 2
HAPol G 2
Q
2 (Å
-2 )
Fig. 4.22 Analysis of quasi-elastic neutron scattering (QENS) spectra measured at 7
C on the IN6
spectrometer of the Institut Laue-Langevin. Left panel, 90 μeV resolution; right panel, 50 μeV resolution.
HAPol sample: half-widths at half-maximum, Γ 1 (blue squares) and Γ 2 (red circles), of the two
Lorentzians fitted to the QENS spectrum, plotted as a function of Q
2
. The “jump diffusion” model fit is
shown for the 50 μeV resolution data (right panel). DAPol sample (green diamonds): Γ value for the
one-Lorentzian fit to the QENS spectrum for the two resolution conditions (From Tehei et al. 2014).
4.3 Self-Association Behavior of Amphipols in Aqueous Solutions
189