

Chap. 12 (§ 12.3.1, Fig. 12.7), this phenomenon is probably of importance in single-particle electron
microscopy experiments, because it affects the rate of thinning of water films in carbon film holes in
the short time interval between blotting and quick-freezing, an important factor in controlling the
spatial distribution of MP/APol complexes within the film (cf. Flötenmeyer et al. 2007).
4.3.1.2.5 Data Pertaining to the Phase Diagram of A8-35
No extensive phase diagrams for A8-35 have been published yet, but there are numerous pieces of
relevant information in the literature, some of which have been mentioned above. They are compiled
here for convenience:
• A8-35 solubility in water and aqueous buffers is >30% w/w (>320 gÁL
À1 ) (Gohon et al.
2006).
• In Tris/HCl 20 mM, NaCl 100 mM, pH 8.0 buffer, particles form above ~0.002 gÁL
À1 (Giusti
et al. 2012).
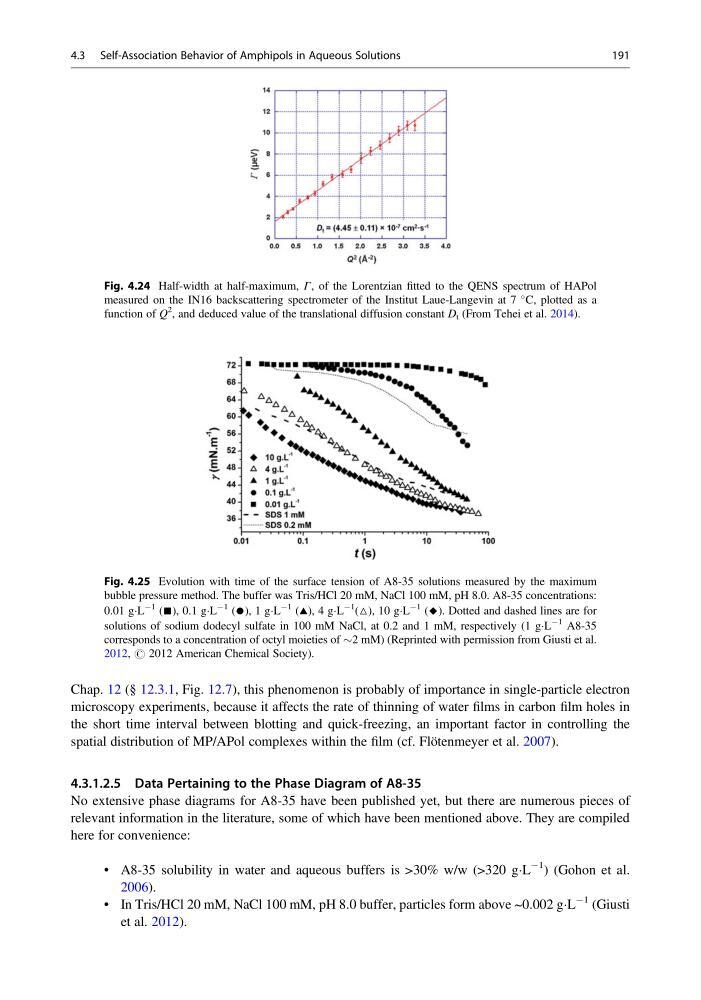
Fig. 4.25 Evolution with time of the surface tension of A8-35 solutions measured by the maximum
bubble pressure method. The buffer was Tris/HCl 20 mM, NaCl 100 mM, pH 8.0. A8-35 concentrations:
0.01 gÁL
À1 (■), 0.1 gÁL
À1 (●), 1 gÁL
À1 (~), 4 gÁL
À1
(△), 10 gÁL
À1 ( ◆ ). Dotted and dashed lines are for
solutions of sodium dodecyl sulfate in 100 mM NaCl, at 0.2 and 1 mM, respectively (1 gÁL
À1 A8-35
corresponds to a concentration of octyl moieties of $2 mM) (Reprinted with permission from Giusti et al.
2012, # 2012 American Chemical Society).
Fig. 4.24 Half-width at half-maximum, Γ, of the Lorentzian fitted to the QENS spectrum of HAPol
measured on the IN16 backscattering spectrometer of the Institut Laue-Langevin at 7
C, plotted as a
function of Q
2
, and deduced value of the translational diffusion constant D t (From Tehei et al. 2014).
4.3 Self-Association Behavior of Amphipols in Aqueous Solutions
191
microscopy experiments, because it affects the rate of thinning of water films in carbon film holes in
the short time interval between blotting and quick-freezing, an important factor in controlling the
spatial distribution of MP/APol complexes within the film (cf. Flötenmeyer et al. 2007).
4.3.1.2.5 Data Pertaining to the Phase Diagram of A8-35
No extensive phase diagrams for A8-35 have been published yet, but there are numerous pieces of
relevant information in the literature, some of which have been mentioned above. They are compiled
here for convenience:
• A8-35 solubility in water and aqueous buffers is >30% w/w (>320 gÁL
À1 ) (Gohon et al.
2006).
• In Tris/HCl 20 mM, NaCl 100 mM, pH 8.0 buffer, particles form above ~0.002 gÁL
À1 (Giusti
et al. 2012).
Fig. 4.25 Evolution with time of the surface tension of A8-35 solutions measured by the maximum
bubble pressure method. The buffer was Tris/HCl 20 mM, NaCl 100 mM, pH 8.0. A8-35 concentrations:
0.01 gÁL
À1 (■), 0.1 gÁL
À1 (●), 1 gÁL
À1 (~), 4 gÁL
À1
(△), 10 gÁL
À1 ( ◆ ). Dotted and dashed lines are for
solutions of sodium dodecyl sulfate in 100 mM NaCl, at 0.2 and 1 mM, respectively (1 gÁL
À1 A8-35
corresponds to a concentration of octyl moieties of $2 mM) (Reprinted with permission from Giusti et al.
2012, # 2012 American Chemical Society).
Fig. 4.24 Half-width at half-maximum, Γ, of the Lorentzian fitted to the QENS spectrum of HAPol
measured on the IN16 backscattering spectrometer of the Institut Laue-Langevin at 7
C, plotted as a
function of Q
2
, and deduced value of the translational diffusion constant D t (From Tehei et al. 2014).
4.3 Self-Association Behavior of Amphipols in Aqueous Solutions
191