

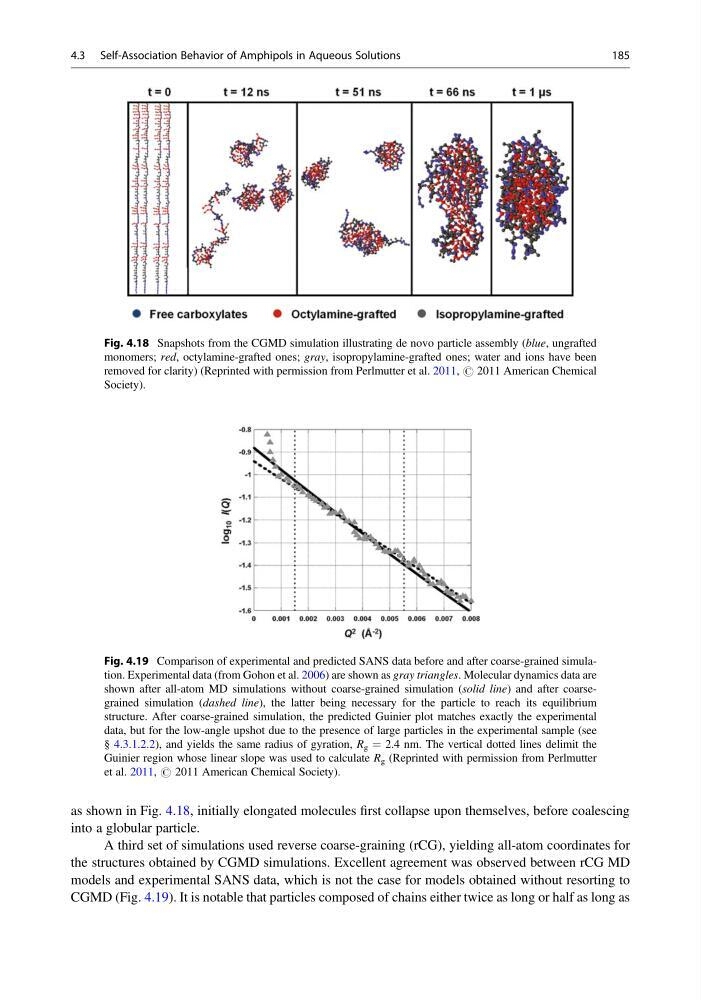
as shown in Fig. 4.18, initially elongated molecules first collapse upon themselves, before coalescing
into a globular particle.
A third set of simulations used reverse coarse-graining (rCG), yielding all-atom coordinates for
the structures obtained by CGMD simulations. Excellent agreement was observed between rCG MD
models and experimental SANS data, which is not the case for models obtained without resorting to
CGMD (Fig. 4.19). It is notable that particles composed of chains either twice as long or half as long as
Fig. 4.18 Snapshots from the CGMD simulation illustrating de novo particle assembly (blue, ungrafted
monomers; red, octylamine-grafted ones; gray, isopropylamine-grafted ones; water and ions have been
removed for clarity) (Reprinted with permission from Perlmutter et al. 2011, # 2011 American Chemical
Society).
Fig. 4.19 Comparison of experimental and predicted SANS data before and after coarse-grained simulation. Experimental data (from Gohon et al. 2006) are shown as gray triangles. Molecular dynamics data are
shown after all-atom MD simulations without coarse-grained simulation (solid line) and after coarsegrained simulation (dashed line), the latter being necessary for the particle to reach its equilibrium
structure. After coarse-grained simulation, the predicted Guinier plot matches exactly the experimental
data, but for the low-angle upshot due to the presence of large particles in the experimental sample (see
§ 4.3.1.2.2), and yields the same radius of gyration, R g ¼ 2.4 nm. The vertical dotted lines delimit the
Guinier region whose linear slope was used to calculate R g (Reprinted with permission from Perlmutter
et al. 2011, # 2011 American Chemical Society).
4.3 Self-Association Behavior of Amphipols in Aqueous Solutions
185
into a globular particle.
A third set of simulations used reverse coarse-graining (rCG), yielding all-atom coordinates for
the structures obtained by CGMD simulations. Excellent agreement was observed between rCG MD
models and experimental SANS data, which is not the case for models obtained without resorting to
CGMD (Fig. 4.19). It is notable that particles composed of chains either twice as long or half as long as
Fig. 4.18 Snapshots from the CGMD simulation illustrating de novo particle assembly (blue, ungrafted
monomers; red, octylamine-grafted ones; gray, isopropylamine-grafted ones; water and ions have been
removed for clarity) (Reprinted with permission from Perlmutter et al. 2011, # 2011 American Chemical
Society).
Fig. 4.19 Comparison of experimental and predicted SANS data before and after coarse-grained simulation. Experimental data (from Gohon et al. 2006) are shown as gray triangles. Molecular dynamics data are
shown after all-atom MD simulations without coarse-grained simulation (solid line) and after coarsegrained simulation (dashed line), the latter being necessary for the particle to reach its equilibrium
structure. After coarse-grained simulation, the predicted Guinier plot matches exactly the experimental
data, but for the low-angle upshot due to the presence of large particles in the experimental sample (see
§ 4.3.1.2.2), and yields the same radius of gyration, R g ¼ 2.4 nm. The vertical dotted lines delimit the
Guinier region whose linear slope was used to calculate R g (Reprinted with permission from Perlmutter
et al. 2011, # 2011 American Chemical Society).
4.3 Self-Association Behavior of Amphipols in Aqueous Solutions
185