

A8-35 (HAPol) or A8-35 deuterated on its side chains (DAPol) overlap perfectly. They are nearly
symmetrical and almost, but not totally, as narrow as that formed by the globular proteins used as
monodisperse standards: their half-height width is ~1.35 mL vs. 0.9–1.0 mL for albumin or horseradish peroxidase (Gohon et al. 2006). DLS reveals a main peak of small particles, with an average size
similar to that estimated by SEC, along with a small proportion of larger contaminants (Fig. 4.14B).
Although conspicuous in scattering experiments, the large objects represent a very small mass fraction
of the samples (see below). In sedimentation velocity AUC (SV-AUC; Fig. 4.14C), the two
preparations give a single peak, with sedimentation coefficients s 20,w ¼ 1.5 S for HAPol and 2.2 S
for DAPol. The decrease of apparent molar mass with increasing angular velocity as well as inspection
of the residuals of the fits confirm the conclusion from SEC data that the small particles are not strictly
homogeneous: at the highest velocity, the largest of them end up in the pellet, which biases the average
molar mass determination toward the smaller mass of those objects that remain in solution. Sample
heterogeneity prevents the numerical estimate of systematic data noise or multi-run global analysis,
leading to a mass estimate with a rather large uncertainty of 40 Æ 5 kDa (Gohon et al. 2006). Finally,
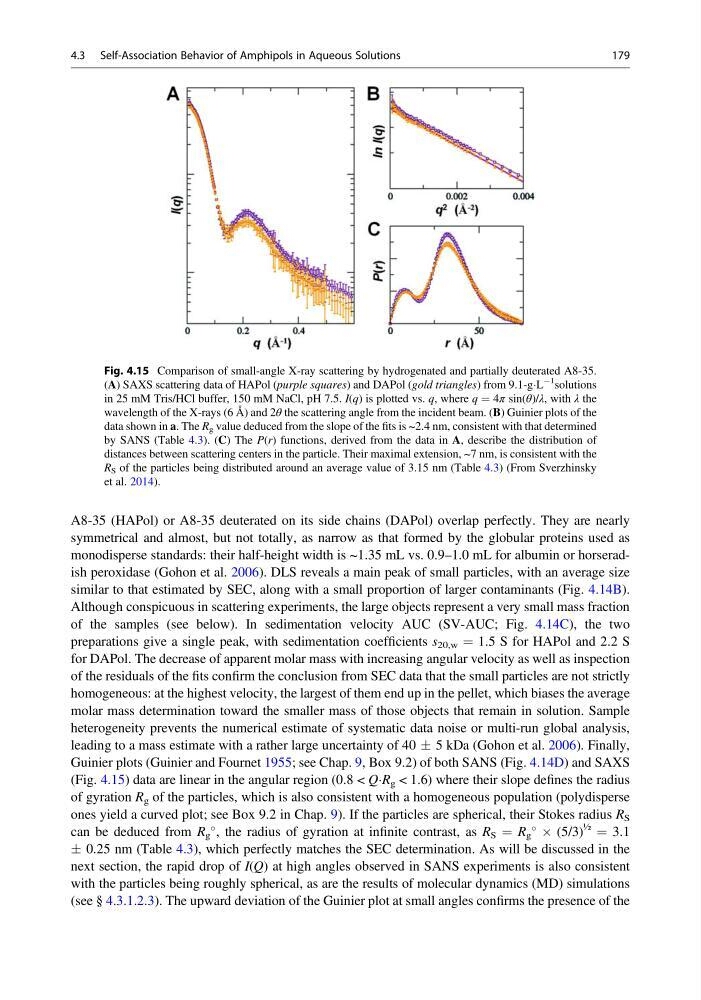
Guinier plots (Guinier and Fournet 1955; see Chap. 9, Box 9.2) of both SANS (Fig. 4.14D) and SAXS
(Fig. 4.15) data are linear in the angular region (0.8 < QÁR g < 1.6) where their slope defines the radius
of gyration R g of the particles, which is also consistent with a homogeneous population (polydisperse
ones yield a curved plot; see Box 9.2 in Chap. 9). If the particles are spherical, their Stokes radius R S
can be deduced from R g
, the radius of gyration at infinite contrast, as R S ¼ R g
 (5/3)
½
¼ 3.1
Æ 0.25 nm (Table 4.3), which perfectly matches the SEC determination. As will be discussed in the
next section, the rapid drop of I(Q) at high angles observed in SANS experiments is also consistent
with the particles being roughly spherical, as are the results of molecular dynamics (MD) simulations
(see § 4.3.1.2.3). The upward deviation of the Guinier plot at small angles confirms the presence of the
Fig. 4.15 Comparison of small-angle X-ray scattering by hydrogenated and partially deuterated A8-35.
(A) SAXS scattering data of HAPol (purple squares) and DAPol (gold triangles) from 9.1-gÁL
À1
solutions
in 25 mM Tris/HCl buffer, 150 mM NaCl, pH 7.5. I(q) is plotted vs. q, where q ¼ 4π sin(θ)/λ, with λ the
wavelength of the X-rays (6 Å) and 2θ the scattering angle from the incident beam. (B) Guinier plots of the
data shown in a. The R g value deduced from the slope of the fits is ~2.4 nm, consistent with that determined
by SANS (Table 4.3). (C) The P(r) functions, derived from the data in A, describe the distribution of
distances between scattering centers in the particle. Their maximal extension, ~7 nm, is consistent with the
R S of the particles being distributed around an average value of 3.15 nm (Table 4.3) (From Sverzhinsky
et al. 2014).
4.3 Self-Association Behavior of Amphipols in Aqueous Solutions
179
symmetrical and almost, but not totally, as narrow as that formed by the globular proteins used as
monodisperse standards: their half-height width is ~1.35 mL vs. 0.9–1.0 mL for albumin or horseradish peroxidase (Gohon et al. 2006). DLS reveals a main peak of small particles, with an average size
similar to that estimated by SEC, along with a small proportion of larger contaminants (Fig. 4.14B).
Although conspicuous in scattering experiments, the large objects represent a very small mass fraction
of the samples (see below). In sedimentation velocity AUC (SV-AUC; Fig. 4.14C), the two
preparations give a single peak, with sedimentation coefficients s 20,w ¼ 1.5 S for HAPol and 2.2 S
for DAPol. The decrease of apparent molar mass with increasing angular velocity as well as inspection
of the residuals of the fits confirm the conclusion from SEC data that the small particles are not strictly
homogeneous: at the highest velocity, the largest of them end up in the pellet, which biases the average
molar mass determination toward the smaller mass of those objects that remain in solution. Sample
heterogeneity prevents the numerical estimate of systematic data noise or multi-run global analysis,
leading to a mass estimate with a rather large uncertainty of 40 Æ 5 kDa (Gohon et al. 2006). Finally,
Guinier plots (Guinier and Fournet 1955; see Chap. 9, Box 9.2) of both SANS (Fig. 4.14D) and SAXS
(Fig. 4.15) data are linear in the angular region (0.8 < QÁR g < 1.6) where their slope defines the radius
of gyration R g of the particles, which is also consistent with a homogeneous population (polydisperse
ones yield a curved plot; see Box 9.2 in Chap. 9). If the particles are spherical, their Stokes radius R S
can be deduced from R g
, the radius of gyration at infinite contrast, as R S ¼ R g
 (5/3)
½
¼ 3.1
Æ 0.25 nm (Table 4.3), which perfectly matches the SEC determination. As will be discussed in the
next section, the rapid drop of I(Q) at high angles observed in SANS experiments is also consistent
with the particles being roughly spherical, as are the results of molecular dynamics (MD) simulations
(see § 4.3.1.2.3). The upward deviation of the Guinier plot at small angles confirms the presence of the
Fig. 4.15 Comparison of small-angle X-ray scattering by hydrogenated and partially deuterated A8-35.
(A) SAXS scattering data of HAPol (purple squares) and DAPol (gold triangles) from 9.1-gÁL
À1
solutions
in 25 mM Tris/HCl buffer, 150 mM NaCl, pH 7.5. I(q) is plotted vs. q, where q ¼ 4π sin(θ)/λ, with λ the
wavelength of the X-rays (6 Å) and 2θ the scattering angle from the incident beam. (B) Guinier plots of the
data shown in a. The R g value deduced from the slope of the fits is ~2.4 nm, consistent with that determined
by SANS (Table 4.3). (C) The P(r) functions, derived from the data in A, describe the distribution of
distances between scattering centers in the particle. Their maximal extension, ~7 nm, is consistent with the
R S of the particles being distributed around an average value of 3.15 nm (Table 4.3) (From Sverzhinsky
et al. 2014).
4.3 Self-Association Behavior of Amphipols in Aqueous Solutions
179