

The advent of electrospray ionization-ion mobility-mass spectrometry (ESI-IM-MS) has
significantly improved the capability of MS to study complex polymeric mixtures (Weidner and
Trimpin 2010; see Chap. 14, § 14.3.1). IM analysis separates ions based on their drift time through
a neutral buffer gas under the influence of a weak electric field, the drift time depending on the ions’
shape (collision cross section) and charge state (Kanu et al. 2008). Coupled with MS, this provides
an extra dimension of separation that is particularly useful in the study of amphipols (see Leney et al.
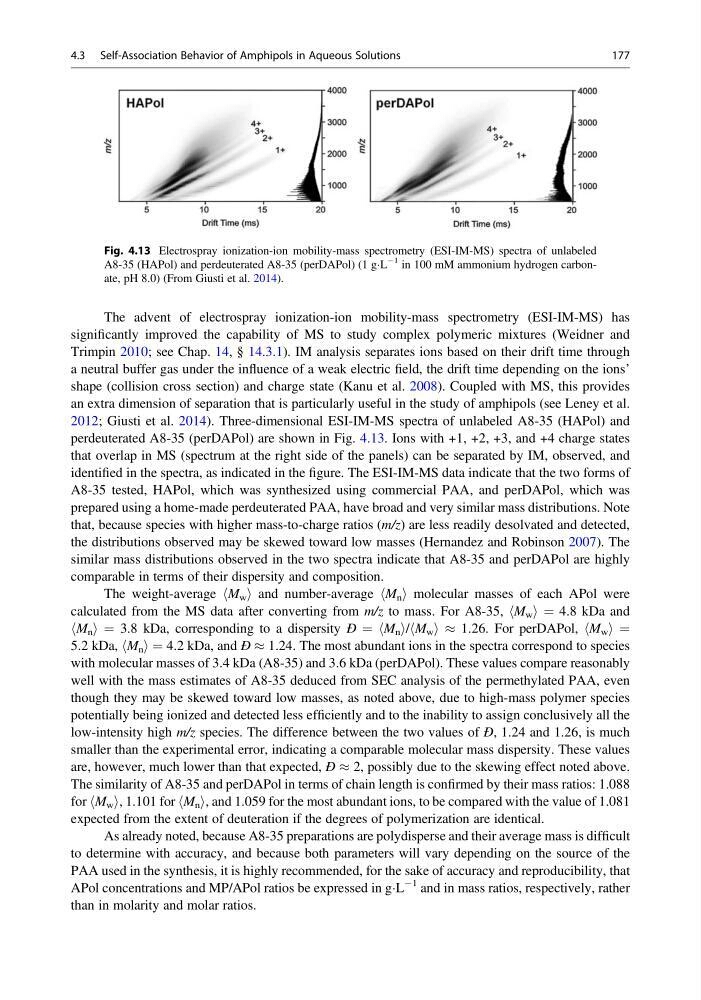
2012; Giusti et al. 2014). Three-dimensional ESI-IM-MS spectra of unlabeled A8-35 (HAPol) and
perdeuterated A8-35 (perDAPol) are shown in Fig. 4.13. Ions with +1, +2, +3, and +4 charge states
that overlap in MS (spectrum at the right side of the panels) can be separated by IM, observed, and
identified in the spectra, as indicated in the figure. The ESI-IM-MS data indicate that the two forms of
A8-35 tested, HAPol, which was synthesized using commercial PAA, and perDAPol, which was
prepared using a home-made perdeuterated PAA, have broad and very similar mass distributions. Note
that, because species with higher mass-to-charge ratios (m/z) are less readily desolvated and detected,
the distributions observed may be skewed toward low masses (Hernandez and Robinson 2007). The
similar mass distributions observed in the two spectra indicate that A8-35 and perDAPol are highly
comparable in terms of their dispersity and composition.
The weight-average hM w i and number-average hM n i molecular masses of each APol were
calculated from the MS data after converting from m/z to mass. For A8-35, hM w i ¼ 4.8 kDa and
hM n i ¼ 3.8 kDa, corresponding to a dispersity Ð ¼ hM n i/hM w i % 1.26. For perDAPol, hM w i ¼
5.2 kDa, hM n i ¼ 4.2 kDa, and Ð % 1.24. The most abundant ions in the spectra correspond to species
with molecular masses of 3.4 kDa (A8-35) and 3.6 kDa (perDAPol). These values compare reasonably
well with the mass estimates of A8-35 deduced from SEC analysis of the permethylated PAA, even
though they may be skewed toward low masses, as noted above, due to high-mass polymer species
potentially being ionized and detected less efficiently and to the inability to assign conclusively all the
low-intensity high m/z species. The difference between the two values of Ð, 1.24 and 1.26, is much
smaller than the experimental error, indicating a comparable molecular mass dispersity. These values
are, however, much lower than that expected, Ð % 2, possibly due to the skewing effect noted above.
The similarity of A8-35 and perDAPol in terms of chain length is confirmed by their mass ratios: 1.088
for hM w i, 1.101 for hM n i, and 1.059 for the most abundant ions, to be compared with the value of 1.081
expected from the extent of deuteration if the degrees of polymerization are identical.
As already noted, because A8-35 preparations are polydisperse and their average mass is difficult
to determine with accuracy, and because both parameters will vary depending on the source of the
PAA used in the synthesis, it is highly recommended, for the sake of accuracy and reproducibility, that
APol concentrations and MP/APol ratios be expressed in gÁL
À1 and in mass ratios, respectively, rather
than in molarity and molar ratios.
Fig. 4.13 Electrospray ionization-ion mobility-mass spectrometry (ESI-IM-MS) spectra of unlabeled
A8-35 (HAPol) and perdeuterated A8-35 (perDAPol) (1 gÁL
À1 in 100 mM ammonium hydrogen carbonate, pH 8.0) (From Giusti et al. 2014).
4.3 Self-Association Behavior of Amphipols in Aqueous Solutions
177
significantly improved the capability of MS to study complex polymeric mixtures (Weidner and
Trimpin 2010; see Chap. 14, § 14.3.1). IM analysis separates ions based on their drift time through
a neutral buffer gas under the influence of a weak electric field, the drift time depending on the ions’
shape (collision cross section) and charge state (Kanu et al. 2008). Coupled with MS, this provides
an extra dimension of separation that is particularly useful in the study of amphipols (see Leney et al.
2012; Giusti et al. 2014). Three-dimensional ESI-IM-MS spectra of unlabeled A8-35 (HAPol) and
perdeuterated A8-35 (perDAPol) are shown in Fig. 4.13. Ions with +1, +2, +3, and +4 charge states
that overlap in MS (spectrum at the right side of the panels) can be separated by IM, observed, and
identified in the spectra, as indicated in the figure. The ESI-IM-MS data indicate that the two forms of
A8-35 tested, HAPol, which was synthesized using commercial PAA, and perDAPol, which was
prepared using a home-made perdeuterated PAA, have broad and very similar mass distributions. Note
that, because species with higher mass-to-charge ratios (m/z) are less readily desolvated and detected,
the distributions observed may be skewed toward low masses (Hernandez and Robinson 2007). The
similar mass distributions observed in the two spectra indicate that A8-35 and perDAPol are highly
comparable in terms of their dispersity and composition.
The weight-average hM w i and number-average hM n i molecular masses of each APol were
calculated from the MS data after converting from m/z to mass. For A8-35, hM w i ¼ 4.8 kDa and
hM n i ¼ 3.8 kDa, corresponding to a dispersity Ð ¼ hM n i/hM w i % 1.26. For perDAPol, hM w i ¼
5.2 kDa, hM n i ¼ 4.2 kDa, and Ð % 1.24. The most abundant ions in the spectra correspond to species
with molecular masses of 3.4 kDa (A8-35) and 3.6 kDa (perDAPol). These values compare reasonably
well with the mass estimates of A8-35 deduced from SEC analysis of the permethylated PAA, even
though they may be skewed toward low masses, as noted above, due to high-mass polymer species
potentially being ionized and detected less efficiently and to the inability to assign conclusively all the
low-intensity high m/z species. The difference between the two values of Ð, 1.24 and 1.26, is much
smaller than the experimental error, indicating a comparable molecular mass dispersity. These values
are, however, much lower than that expected, Ð % 2, possibly due to the skewing effect noted above.
The similarity of A8-35 and perDAPol in terms of chain length is confirmed by their mass ratios: 1.088
for hM w i, 1.101 for hM n i, and 1.059 for the most abundant ions, to be compared with the value of 1.081
expected from the extent of deuteration if the degrees of polymerization are identical.
As already noted, because A8-35 preparations are polydisperse and their average mass is difficult
to determine with accuracy, and because both parameters will vary depending on the source of the
PAA used in the synthesis, it is highly recommended, for the sake of accuracy and reproducibility, that
APol concentrations and MP/APol ratios be expressed in gÁL
À1 and in mass ratios, respectively, rather
than in molarity and molar ratios.
Fig. 4.13 Electrospray ionization-ion mobility-mass spectrometry (ESI-IM-MS) spectra of unlabeled
A8-35 (HAPol) and perdeuterated A8-35 (perDAPol) (1 gÁL
À1 in 100 mM ammonium hydrogen carbonate, pH 8.0) (From Giusti et al. 2014).
4.3 Self-Association Behavior of Amphipols in Aqueous Solutions
177