

considerably reduced as compared to a detergent carrying a single copy of the same hydrophobic
chain, leading to low CAC values. Inversely, for APols that carry net charges, like A8-35, bringing
these charges together is electrostatically costly, which will raise the CAC, in the same way that
sodium dodecyl sulfate (SDS) has a higher CMC than dodecylmaltoside despite carrying the same
alkyl chain (Chap. 2).
Low CMCs or CACs can be rather tricky to measure. In the case of A8-35, two very distinct
approaches were resorted to, which yielded reasonably consistent results (Giusti et al. 2012). The
buffer used was Tris/HCl 20 mM, NaCl 100 mM, pH 8.0. At this pH, most of the carboxylates of
A8-35 are known to be deprotonated (Gohon et al. 2004).
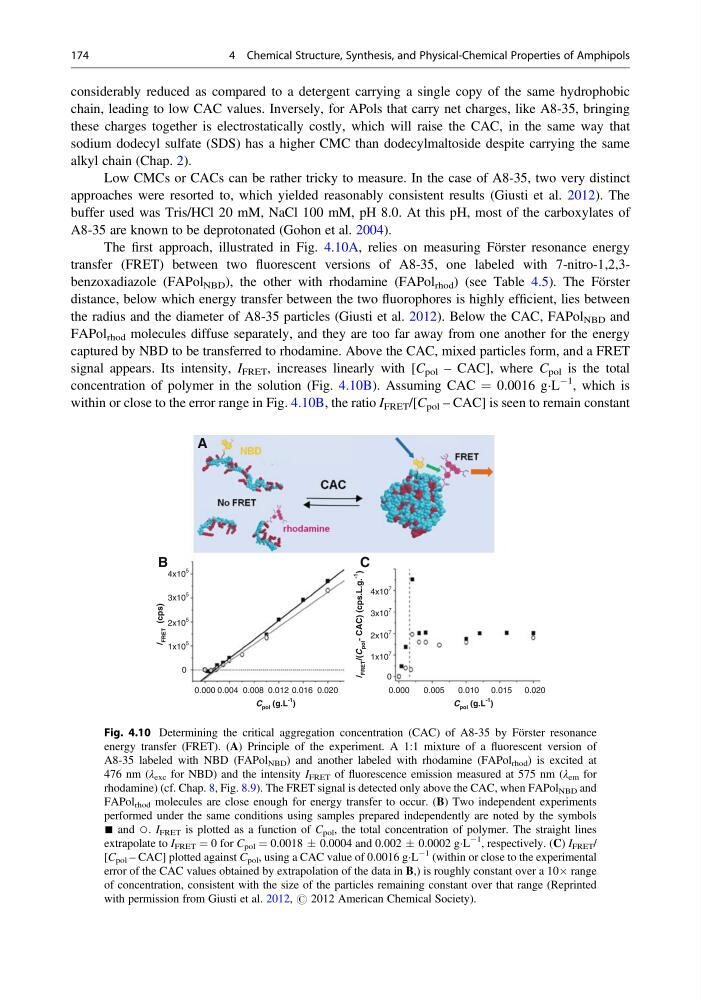
The first approach, illustrated in Fig. 4.10A, relies on measuring Förster resonance energy
transfer (FRET) between two fluorescent versions of A8-35, one labeled with 7-nitro-1,2,3benzoxadiazole (FAPol NBD ), the other with rhodamine (FAPol rhod ) (see Table 4.5). The Förster
distance, below which energy transfer between the two fluorophores is highly efficient, lies between
the radius and the diameter of A8-35 particles (Giusti et al. 2012). Below the CAC, FAPol NBD and
FAPol rhod molecules diffuse separately, and they are too far away from one another for the energy
captured by NBD to be transferred to rhodamine. Above the CAC, mixed particles form, and a FRET
signal appears. Its intensity, I FRET , increases linearly with [C pol – CAC], where C pol is the total
concentration of polymer in the solution (Fig. 4.10B). Assuming CAC ¼ 0.0016 gÁL
À1 , which is
within or close to the error range in Fig. 4.10B, the ratio I FRET /[C pol – CAC] is seen to remain constant
4x10
5
3x10
5
2x10
5
1x10
5
0
0.000 0.004
C pol (g.L
-1 )
/
FRET
(cps)
C pol (g.L
-1
)
0.008 0.012 0.016 0.020
0.000
0.005
0.010 0.015
0.020
B
A
4x10
7
3x10
7
2x10
7
1x10
7
/
FRET
/(C
pol
- CAC) (cps.L.g.
-1
)
C
0
Fig. 4.10 Determining the critical aggregation concentration (CAC) of A8-35 by Förster resonance
energy transfer (FRET). (A) Principle of the experiment. A 1:1 mixture of a fluorescent version of
A8-35 labeled with NBD (FAPol NBD ) and another labeled with rhodamine (FAPol rhod ) is excited at
476 nm (λ exc for NBD) and the intensity I FRET of fluorescence emission measured at 575 nm (λ em for
rhodamine) (cf. Chap. 8, Fig. 8.9). The FRET signal is detected only above the CAC, when FAPol NBD and
FAPol rhod molecules are close enough for energy transfer to occur. (B) Two independent experiments
performed under the same conditions using samples prepared independently are noted by the symbols
■ and ○. I FRET is plotted as a function of C pol , the total concentration of polymer. The straight lines
extrapolate to I FRET ¼ 0 for C pol ¼ 0.0018 Æ 0.0004 and 0.002 Æ 0.0002 gÁL
À1
, respectively. (C) I FRET /
[C pol – CAC] plotted against C pol , using a CAC value of 0.0016 gÁL
À1 (within or close to the experimental
error of the CAC values obtained by extrapolation of the data in B,) is roughly constant over a 10Â range
of concentration, consistent with the size of the particles remaining constant over that range (Reprinted
with permission from Giusti et al. 2012, # 2012 American Chemical Society).
174
4 Chemical Structure, Synthesis, and Physical-Chemical Properties of Amphipols
chain, leading to low CAC values. Inversely, for APols that carry net charges, like A8-35, bringing
these charges together is electrostatically costly, which will raise the CAC, in the same way that
sodium dodecyl sulfate (SDS) has a higher CMC than dodecylmaltoside despite carrying the same
alkyl chain (Chap. 2).
Low CMCs or CACs can be rather tricky to measure. In the case of A8-35, two very distinct
approaches were resorted to, which yielded reasonably consistent results (Giusti et al. 2012). The
buffer used was Tris/HCl 20 mM, NaCl 100 mM, pH 8.0. At this pH, most of the carboxylates of
A8-35 are known to be deprotonated (Gohon et al. 2004).
The first approach, illustrated in Fig. 4.10A, relies on measuring Förster resonance energy
transfer (FRET) between two fluorescent versions of A8-35, one labeled with 7-nitro-1,2,3benzoxadiazole (FAPol NBD ), the other with rhodamine (FAPol rhod ) (see Table 4.5). The Förster
distance, below which energy transfer between the two fluorophores is highly efficient, lies between
the radius and the diameter of A8-35 particles (Giusti et al. 2012). Below the CAC, FAPol NBD and
FAPol rhod molecules diffuse separately, and they are too far away from one another for the energy
captured by NBD to be transferred to rhodamine. Above the CAC, mixed particles form, and a FRET
signal appears. Its intensity, I FRET , increases linearly with [C pol – CAC], where C pol is the total
concentration of polymer in the solution (Fig. 4.10B). Assuming CAC ¼ 0.0016 gÁL
À1 , which is
within or close to the error range in Fig. 4.10B, the ratio I FRET /[C pol – CAC] is seen to remain constant
4x10
5
3x10
5
2x10
5
1x10
5
0
0.000 0.004
C pol (g.L
-1 )
/
FRET
(cps)
C pol (g.L
-1
)
0.008 0.012 0.016 0.020
0.000
0.005
0.010 0.015
0.020
B
A
4x10
7
3x10
7
2x10
7
1x10
7
/
FRET
/(C
pol
- CAC) (cps.L.g.
-1
)
C
0
Fig. 4.10 Determining the critical aggregation concentration (CAC) of A8-35 by Förster resonance
energy transfer (FRET). (A) Principle of the experiment. A 1:1 mixture of a fluorescent version of
A8-35 labeled with NBD (FAPol NBD ) and another labeled with rhodamine (FAPol rhod ) is excited at
476 nm (λ exc for NBD) and the intensity I FRET of fluorescence emission measured at 575 nm (λ em for
rhodamine) (cf. Chap. 8, Fig. 8.9). The FRET signal is detected only above the CAC, when FAPol NBD and
FAPol rhod molecules are close enough for energy transfer to occur. (B) Two independent experiments
performed under the same conditions using samples prepared independently are noted by the symbols
■ and ○. I FRET is plotted as a function of C pol , the total concentration of polymer. The straight lines
extrapolate to I FRET ¼ 0 for C pol ¼ 0.0018 Æ 0.0004 and 0.002 Æ 0.0002 gÁL
À1
, respectively. (C) I FRET /
[C pol – CAC] plotted against C pol , using a CAC value of 0.0016 gÁL
À1 (within or close to the experimental
error of the CAC values obtained by extrapolation of the data in B,) is roughly constant over a 10Â range
of concentration, consistent with the size of the particles remaining constant over that range (Reprinted
with permission from Giusti et al. 2012, # 2012 American Chemical Society).
174
4 Chemical Structure, Synthesis, and Physical-Chemical Properties of Amphipols