

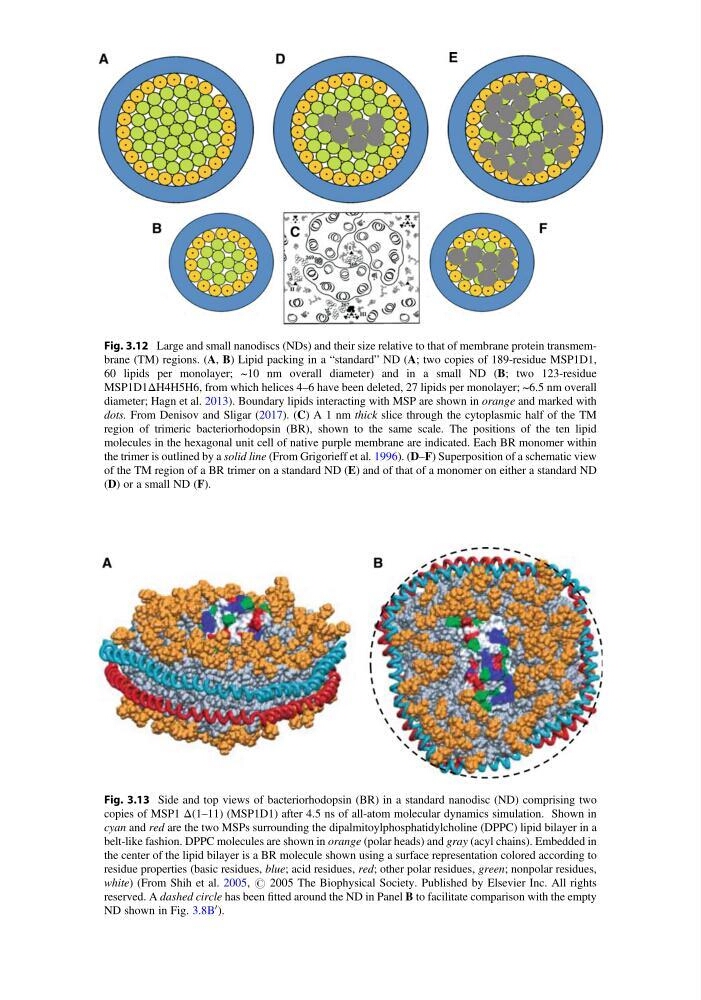
Fig. 3.12 Large and small nanodiscs (NDs) and their size relative to that of membrane protein transmembrane (TM) regions. (A, B) Lipid packing in a “standard” ND (A; two copies of 189-residue MSP1D1,
60 lipids per monolayer; ~10 nm overall diameter) and in a small ND (B; two 123-residue
MSP1D1ΔH4H5H6, from which helices 4–6 have been deleted, 27 lipids per monolayer; ~6.5 nm overall
diameter; Hagn et al. 2013). Boundary lipids interacting with MSP are shown in orange and marked with
dots. From Denisov and Sligar (2017). (C) A 1 nm thick slice through the cytoplasmic half of the TM
region of trimeric bacteriorhodopsin (BR), shown to the same scale. The positions of the ten lipid
molecules in the hexagonal unit cell of native purple membrane are indicated. Each BR monomer within
the trimer is outlined by a solid line (From Grigorieff et al. 1996). (D–F) Superposition of a schematic view
of the TM region of a BR trimer on a standard ND (E) and of that of a monomer on either a standard ND
(D) or a small ND (F).
Fig. 3.13 Side and top views of bacteriorhodopsin (BR) in a standard nanodisc (ND) comprising two
copies of MSP1 Δ(1–11) (MSP1D1) after 4.5 ns of all-atom molecular dynamics simulation. Shown in
cyan and red are the two MSPs surrounding the dipalmitoylphosphatidylcholine (DPPC) lipid bilayer in a
belt-like fashion. DPPC molecules are shown in orange (polar heads) and gray (acyl chains). Embedded in
the center of the lipid bilayer is a BR molecule shown using a surface representation colored according to
residue properties (basic residues, blue; acid residues, red; other polar residues, green; nonpolar residues,
white) (From Shih et al. 2005, # 2005 The Biophysical Society. Published by Elsevier Inc. All rights
reserved. A dashed circle has been fitted around the ND in Panel B to facilitate comparison with the empty
ND shown in Fig. 3.8B
0 ).
60 lipids per monolayer; ~10 nm overall diameter) and in a small ND (B; two 123-residue
MSP1D1ΔH4H5H6, from which helices 4–6 have been deleted, 27 lipids per monolayer; ~6.5 nm overall
diameter; Hagn et al. 2013). Boundary lipids interacting with MSP are shown in orange and marked with
dots. From Denisov and Sligar (2017). (C) A 1 nm thick slice through the cytoplasmic half of the TM
region of trimeric bacteriorhodopsin (BR), shown to the same scale. The positions of the ten lipid
molecules in the hexagonal unit cell of native purple membrane are indicated. Each BR monomer within
the trimer is outlined by a solid line (From Grigorieff et al. 1996). (D–F) Superposition of a schematic view
of the TM region of a BR trimer on a standard ND (E) and of that of a monomer on either a standard ND
(D) or a small ND (F).
Fig. 3.13 Side and top views of bacteriorhodopsin (BR) in a standard nanodisc (ND) comprising two
copies of MSP1 Δ(1–11) (MSP1D1) after 4.5 ns of all-atom molecular dynamics simulation. Shown in
cyan and red are the two MSPs surrounding the dipalmitoylphosphatidylcholine (DPPC) lipid bilayer in a
belt-like fashion. DPPC molecules are shown in orange (polar heads) and gray (acyl chains). Embedded in
the center of the lipid bilayer is a BR molecule shown using a surface representation colored according to
residue properties (basic residues, blue; acid residues, red; other polar residues, green; nonpolar residues,
white) (From Shih et al. 2005, # 2005 The Biophysical Society. Published by Elsevier Inc. All rights
reserved. A dashed circle has been fitted around the ND in Panel B to facilitate comparison with the empty
ND shown in Fig. 3.8B
0 ).