

17 Theoretical Analysis of Phase-Transition Temperature
325
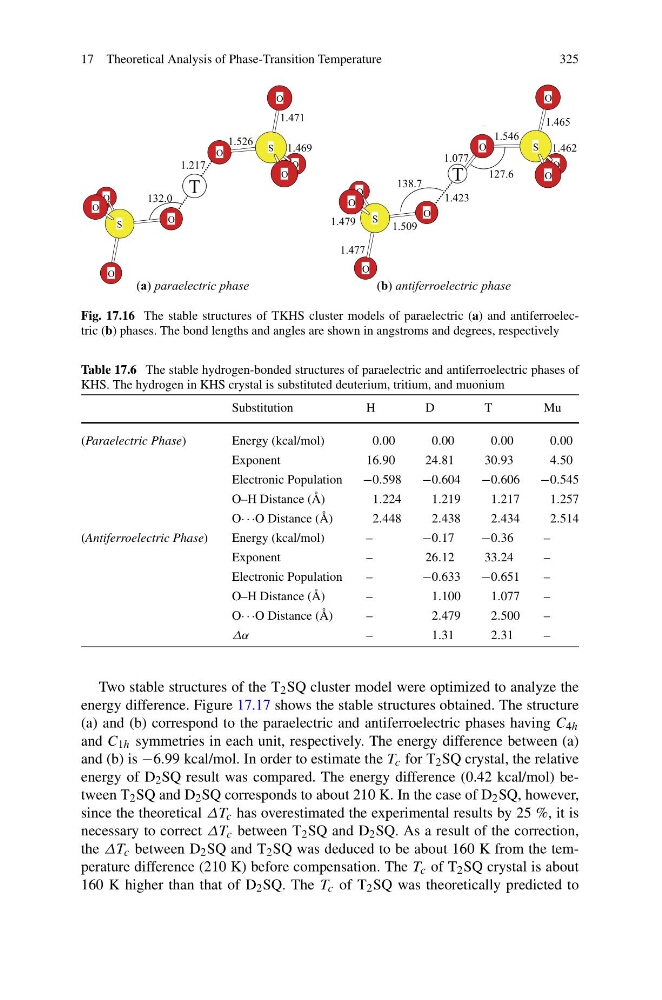
Fig. 17.16 The stable structures of TKHS cluster models of paraelectric (a) and antiferroelectric (b) phases. The bond lengths and angles are shown in angstroms and degrees, respectively
Table 17.6 The stable hydrogen-bonded structures of paraelectric and antiferroelectric phases of
KHS. The hydrogen in KHS crystal is substituted deuterium, tritium, and muonium
Substitution
H
D
T
Mu
(Paraelectric Phase)
Energy (kcal/mol)
0.00
0.00
0.00
0.00
Exponent
16.90
24.81
30.93
4.50
Electronic Population
−0.598
−0.604
−0.606
−0.545
O–H Distance (Å)
1.224
1.219
1.217
1.257
O· · ·O Distance (Å)
2.448
2.438
2.434
2.514
(Antiferroelectric Phase)
Energy (kcal/mol)
–
−0.17
−0.36
–
Exponent
–
26.12
33.24
–
Electronic Population
–
−0.633
−0.651
–
O–H Distance (Å)
–
1.100
1.077
–
O· · ·O Distance (Å)
–
2.479
2.500
–
Δα
–
1 .31
2.31
–
Two stable structures of the T 2 SQ cluster model were optimized to analyze the
energy difference. Figure 17.17 shows the stable structures obtained. The structure
(a) and (b) correspond to the paraelectric and antiferroelectric phases having C 4h
and C 1h symmetries in each unit, respectively. The energy difference between (a)
and (b) is −6.99 kcal/mol. In order to estimate the T c for T 2 SQ crystal, the relative
energy of D 2 SQ result was compared. The energy difference (0.42 kcal/mol) between T 2 SQ and D 2 SQ corresponds to about 210 K. In the case of D 2 SQ, however,
since the theoretical ΔT c has overestimated the experimental results by 25 %, it is
necessary to correct ΔT c between T 2 SQ and D 2 SQ. As a result of the correction,
the ΔT c between D 2 SQ and T 2 SQ was deduced to be about 160 K from the temperature difference (210 K) before compensation. The T c of T 2 SQ crystal is about
160 K higher than that of D 2 SQ. The T c of T 2 SQ was theoretically predicted to
325
Fig. 17.16 The stable structures of TKHS cluster models of paraelectric (a) and antiferroelectric (b) phases. The bond lengths and angles are shown in angstroms and degrees, respectively
Table 17.6 The stable hydrogen-bonded structures of paraelectric and antiferroelectric phases of
KHS. The hydrogen in KHS crystal is substituted deuterium, tritium, and muonium
Substitution
H
D
T
Mu
(Paraelectric Phase)
Energy (kcal/mol)
0.00
0.00
0.00
0.00
Exponent
16.90
24.81
30.93
4.50
Electronic Population
−0.598
−0.604
−0.606
−0.545
O–H Distance (Å)
1.224
1.219
1.217
1.257
O· · ·O Distance (Å)
2.448
2.438
2.434
2.514
(Antiferroelectric Phase)
Energy (kcal/mol)
–
−0.17
−0.36
–
Exponent
–
26.12
33.24
–
Electronic Population
–
−0.633
−0.651
–
O–H Distance (Å)
–
1.100
1.077
–
O· · ·O Distance (Å)
–
2.479
2.500
–
Δα
–
1 .31
2.31
–
Two stable structures of the T 2 SQ cluster model were optimized to analyze the
energy difference. Figure 17.17 shows the stable structures obtained. The structure
(a) and (b) correspond to the paraelectric and antiferroelectric phases having C 4h
and C 1h symmetries in each unit, respectively. The energy difference between (a)
and (b) is −6.99 kcal/mol. In order to estimate the T c for T 2 SQ crystal, the relative
energy of D 2 SQ result was compared. The energy difference (0.42 kcal/mol) between T 2 SQ and D 2 SQ corresponds to about 210 K. In the case of D 2 SQ, however,
since the theoretical ΔT c has overestimated the experimental results by 25 %, it is
necessary to correct ΔT c between T 2 SQ and D 2 SQ. As a result of the correction,
the ΔT c between D 2 SQ and T 2 SQ was deduced to be about 160 K from the temperature difference (210 K) before compensation. The T c of T 2 SQ crystal is about
160 K higher than that of D 2 SQ. The T c of T 2 SQ was theoretically predicted to