

324
T. Ishimoto and M. Tachikawa
Table 17.5 The stable hydrogen-bonded structures of paraelectric and antiferroelectric phases of
mixed (H 1−x D x ) 2 SQ
D concentration (x) 0.00
0.25
0.50
0.75
1.00
a (Paraelectric Phase)
Energy (kcal/mol)
0.00
0.00
0.00
0.00
0.00
Exponent
16.67 18.94
20.94
22.80
24.58
Electronic Population −0.481 −0.485 −0.487 −0.488 −0.490
O–H Distance (Å)
1.210 1.208
1.207
1.205
1.204
O· · ·O Distance (Å)
2.420 2.416
2.414
2.410
2.408
b (Antiferroelectric Phase) Energy (kcal/mol)
−6.19 −6.30 −6.40 −6.49
−6.57
Exponent
17.65 20.20
22.66
24.77
26.89
Electronic Population −0.513 −0.523 −0.534 −0.539 −0.546
O–H Distance (Å)
1.096 1.083
1.070
1.066 1058
O· · ·O Distance (Å)
2.468 2.474
2.484
2.486
2.496
ΔT c
0
57
109
153
192
Δα
0.98
1.26
1.72
1.97
2.31
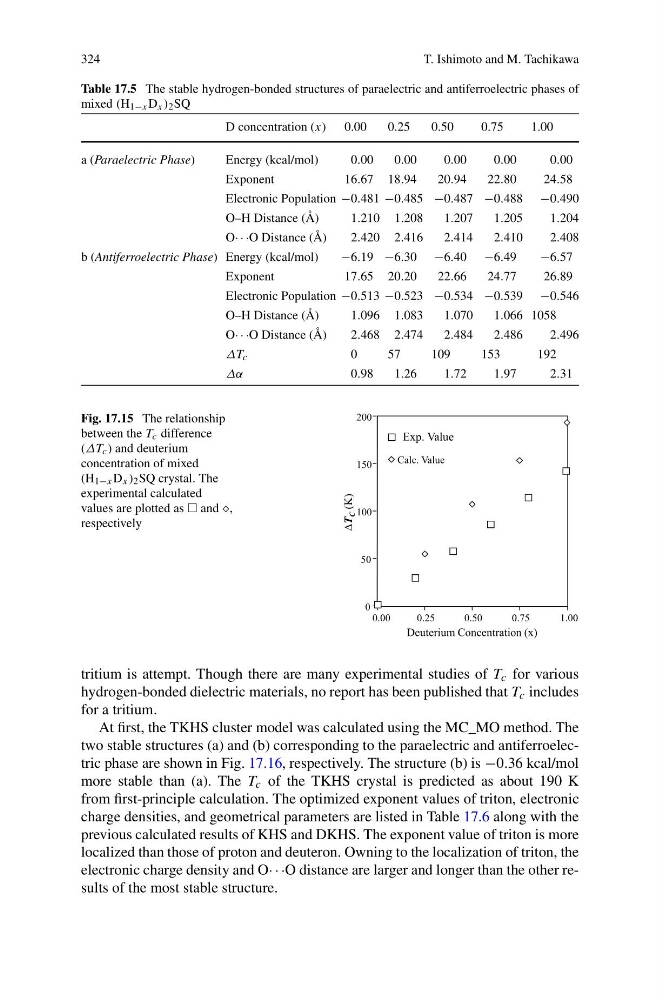
Fig. 17.15 The relationship
between the T c difference
(ΔT c ) and deuterium
concentration of mixed
(H 1−x D x ) 2 SQ crystal. The
experimental calculated
values are plotted as and ,
respectively
tritium is attempt. Though there are many experimental studies of T c for various
hydrogen-bonded dielectric materials, no report has been published that T c includes
for a tritium.
At first, the TKHS cluster model was calculated using the MC_MO method. The
two stable structures (a) and (b) corresponding to the paraelectric and antiferroelectric phase are shown in Fig. 17.16, respectively. The structure (b) is −0.36 kcal/mol
more stable than (a). The T c of the TKHS crystal is predicted as about 190 K
from first-principle calculation. The optimized exponent values of triton, electronic
charge densities, and geometrical parameters are listed in Table 17.6 along with the
previous calculated results of KHS and DKHS. The exponent value of triton is more
localized than those of proton and deuteron. Owning to the localization of triton, the
electronic charge density and O· · ·O distance are larger and longer than the other results of the most stable structure.
T. Ishimoto and M. Tachikawa
Table 17.5 The stable hydrogen-bonded structures of paraelectric and antiferroelectric phases of
mixed (H 1−x D x ) 2 SQ
D concentration (x) 0.00
0.25
0.50
0.75
1.00
a (Paraelectric Phase)
Energy (kcal/mol)
0.00
0.00
0.00
0.00
0.00
Exponent
16.67 18.94
20.94
22.80
24.58
Electronic Population −0.481 −0.485 −0.487 −0.488 −0.490
O–H Distance (Å)
1.210 1.208
1.207
1.205
1.204
O· · ·O Distance (Å)
2.420 2.416
2.414
2.410
2.408
b (Antiferroelectric Phase) Energy (kcal/mol)
−6.19 −6.30 −6.40 −6.49
−6.57
Exponent
17.65 20.20
22.66
24.77
26.89
Electronic Population −0.513 −0.523 −0.534 −0.539 −0.546
O–H Distance (Å)
1.096 1.083
1.070
1.066 1058
O· · ·O Distance (Å)
2.468 2.474
2.484
2.486
2.496
ΔT c
0
57
109
153
192
Δα
0.98
1.26
1.72
1.97
2.31
Fig. 17.15 The relationship
between the T c difference
(ΔT c ) and deuterium
concentration of mixed
(H 1−x D x ) 2 SQ crystal. The
experimental calculated
values are plotted as and ,
respectively
tritium is attempt. Though there are many experimental studies of T c for various
hydrogen-bonded dielectric materials, no report has been published that T c includes
for a tritium.
At first, the TKHS cluster model was calculated using the MC_MO method. The
two stable structures (a) and (b) corresponding to the paraelectric and antiferroelectric phase are shown in Fig. 17.16, respectively. The structure (b) is −0.36 kcal/mol
more stable than (a). The T c of the TKHS crystal is predicted as about 190 K
from first-principle calculation. The optimized exponent values of triton, electronic
charge densities, and geometrical parameters are listed in Table 17.6 along with the
previous calculated results of KHS and DKHS. The exponent value of triton is more
localized than those of proton and deuteron. Owning to the localization of triton, the
electronic charge density and O· · ·O distance are larger and longer than the other results of the most stable structure.