

17 Theoretical Analysis of Phase-Transition Temperature
311
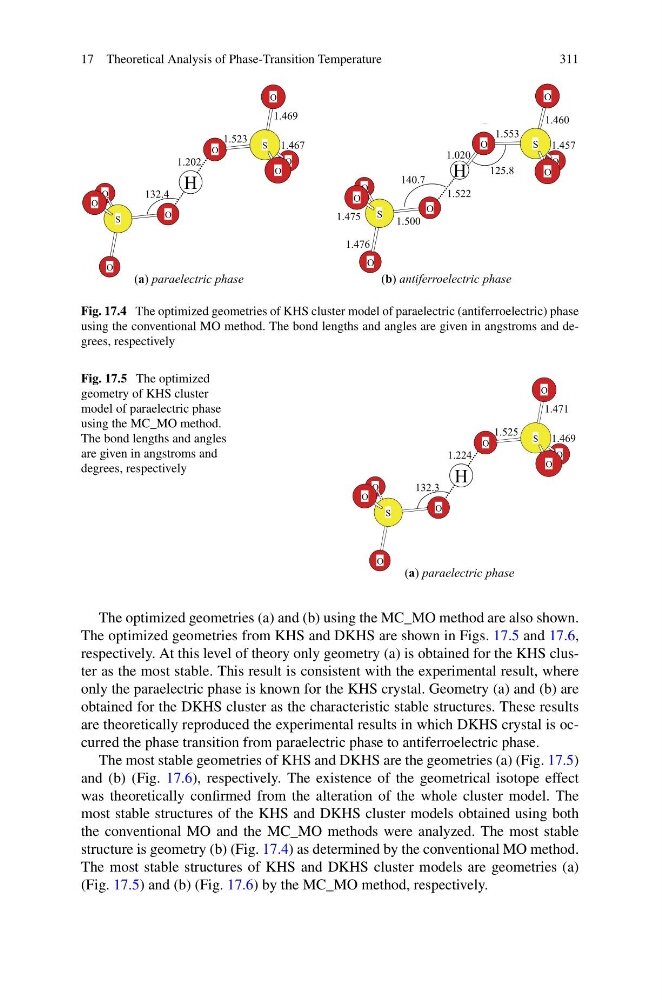
Fig. 17.4 The optimized geometries of KHS cluster model of paraelectric (antiferroelectric) phase
using the conventional MO method. The bond lengths and angles are given in angstroms and degrees, respectively
Fig. 17.5 The optimized
geometry of KHS cluster
model of paraelectric phase
using the MC_MO method.
The bond lengths and angles
are given in angstroms and
degrees, respectively
The optimized geometries (a) and (b) using the MC_MO method are also shown.
The optimized geometries from KHS and DKHS are shown in Figs. 17.5 and 17.6,
respectively. At this level of theory only geometry (a) is obtained for the KHS cluster as the most stable. This result is consistent with the experimental result, where
only the paraelectric phase is known for the KHS crystal. Geometry (a) and (b) are
obtained for the DKHS cluster as the characteristic stable structures. These results
are theoretically reproduced the experimental results in which DKHS crystal is occurred the phase transition from paraelectric phase to antiferroelectric phase.
The most stable geometries of KHS and DKHS are the geometries (a) (Fig. 17.5)
and (b) (Fig. 17.6), respectively. The existence of the geometrical isotope effect
was theoretically confirmed from the alteration of the whole cluster model. The
most stable structures of the KHS and DKHS cluster models obtained using both
the conventional MO and the MC_MO methods were analyzed. The most stable
structure is geometry (b) (Fig. 17.4) as determined by the conventional MO method.
The most stable structures of KHS and DKHS cluster models are geometries (a)
(Fig. 17.5) and (b) (Fig. 17.6) by the MC_MO method, respectively.
311
Fig. 17.4 The optimized geometries of KHS cluster model of paraelectric (antiferroelectric) phase
using the conventional MO method. The bond lengths and angles are given in angstroms and degrees, respectively
Fig. 17.5 The optimized
geometry of KHS cluster
model of paraelectric phase
using the MC_MO method.
The bond lengths and angles
are given in angstroms and
degrees, respectively
The optimized geometries (a) and (b) using the MC_MO method are also shown.
The optimized geometries from KHS and DKHS are shown in Figs. 17.5 and 17.6,
respectively. At this level of theory only geometry (a) is obtained for the KHS cluster as the most stable. This result is consistent with the experimental result, where
only the paraelectric phase is known for the KHS crystal. Geometry (a) and (b) are
obtained for the DKHS cluster as the characteristic stable structures. These results
are theoretically reproduced the experimental results in which DKHS crystal is occurred the phase transition from paraelectric phase to antiferroelectric phase.
The most stable geometries of KHS and DKHS are the geometries (a) (Fig. 17.5)
and (b) (Fig. 17.6), respectively. The existence of the geometrical isotope effect
was theoretically confirmed from the alteration of the whole cluster model. The
most stable structures of the KHS and DKHS cluster models obtained using both
the conventional MO and the MC_MO methods were analyzed. The most stable
structure is geometry (b) (Fig. 17.4) as determined by the conventional MO method.
The most stable structures of KHS and DKHS cluster models are geometries (a)
(Fig. 17.5) and (b) (Fig. 17.6) by the MC_MO method, respectively.