

294
E.F. Sheka et al.
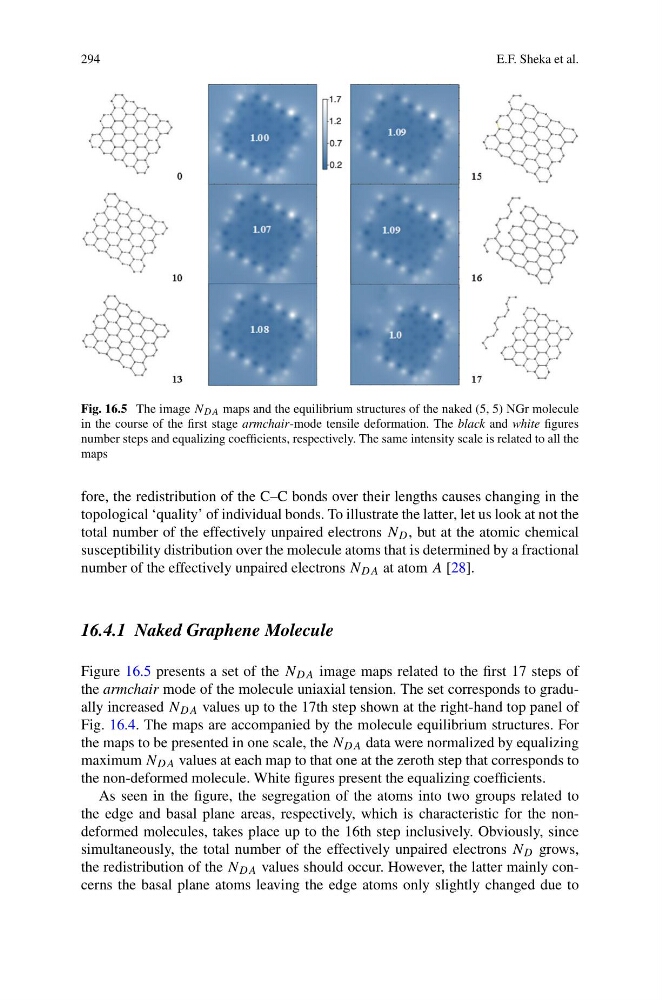
Fig. 16.5 The image N DA maps and the equilibrium structures of the naked (5, 5) NGr molecule
in the course of the first stage armchair-mode tensile deformation. The black and white figures
number steps and equalizing coefficients, respectively. The same intensity scale is related to all the
maps
fore, the redistribution of the C–C bonds over their lengths causes changing in the
topological ‘quality’ of individual bonds. To illustrate the latter, let us look at not the
total number of the effectively unpaired electrons N D , but at the atomic chemical
susceptibility distribution over the molecule atoms that is determined by a fractional
number of the effectively unpaired electrons N DA at atom A [28].
16.4.1 Naked Graphene Molecule
Figure 16.5 presents a set of the N DA image maps related to the first 17 steps of
the armchair mode of the molecule uniaxial tension. The set corresponds to gradually increased N DA values up to the 17th step shown at the right-hand top panel of
Fig. 16.4. The maps are accompanied by the molecule equilibrium structures. For
the maps to be presented in one scale, the N DA data were normalized by equalizing
maximum N DA values at each map to that one at the zeroth step that corresponds to
the non-deformed molecule. White figures present the equalizing coefficients.
As seen in the figure, the segregation of the atoms into two groups related to
the edge and basal plane areas, respectively, which is characteristic for the nondeformed molecules, takes place up to the 16th step inclusively. Obviously, since
simultaneously, the total number of the effectively unpaired electrons N D grows,
the redistribution of the N DA values should occur. However, the latter mainly concerns the basal plane atoms leaving the edge atoms only slightly changed due to
E.F. Sheka et al.
Fig. 16.5 The image N DA maps and the equilibrium structures of the naked (5, 5) NGr molecule
in the course of the first stage armchair-mode tensile deformation. The black and white figures
number steps and equalizing coefficients, respectively. The same intensity scale is related to all the
maps
fore, the redistribution of the C–C bonds over their lengths causes changing in the
topological ‘quality’ of individual bonds. To illustrate the latter, let us look at not the
total number of the effectively unpaired electrons N D , but at the atomic chemical
susceptibility distribution over the molecule atoms that is determined by a fractional
number of the effectively unpaired electrons N DA at atom A [28].
16.4.1 Naked Graphene Molecule
Figure 16.5 presents a set of the N DA image maps related to the first 17 steps of
the armchair mode of the molecule uniaxial tension. The set corresponds to gradually increased N DA values up to the 17th step shown at the right-hand top panel of
Fig. 16.4. The maps are accompanied by the molecule equilibrium structures. For
the maps to be presented in one scale, the N DA data were normalized by equalizing
maximum N DA values at each map to that one at the zeroth step that corresponds to
the non-deformed molecule. White figures present the equalizing coefficients.
As seen in the figure, the segregation of the atoms into two groups related to
the edge and basal plane areas, respectively, which is characteristic for the nondeformed molecules, takes place up to the 16th step inclusively. Obviously, since
simultaneously, the total number of the effectively unpaired electrons N D grows,
the redistribution of the N DA values should occur. However, the latter mainly concerns the basal plane atoms leaving the edge atoms only slightly changed due to