

16 Topological Mechanochemistry of Graphene
295
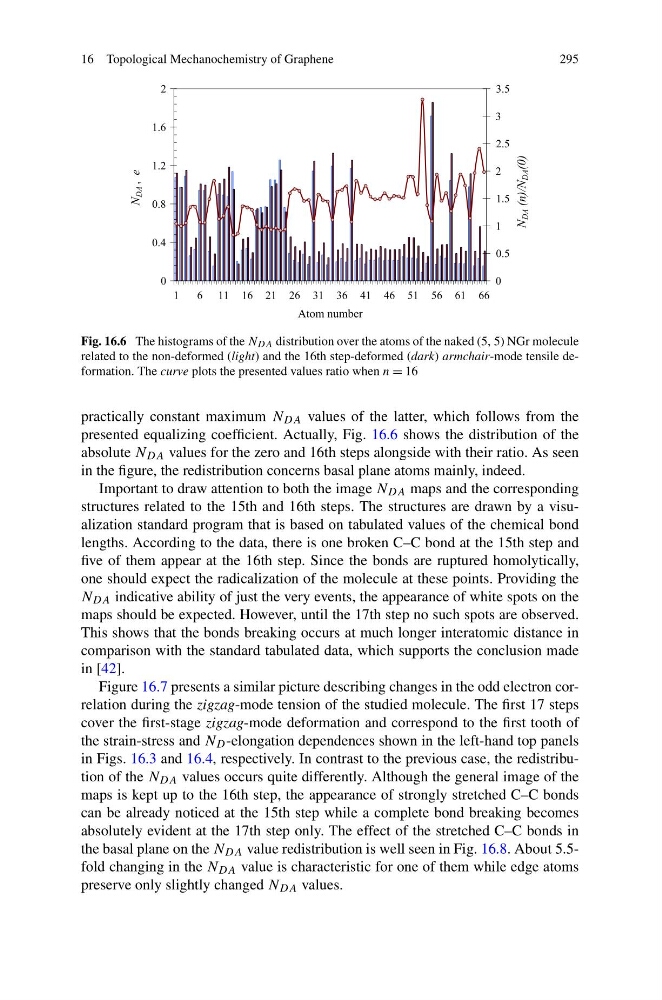
Fig. 16.6 The histograms of the N DA distribution over the atoms of the naked (5, 5) NGr molecule
related to the non-deformed (light) and the 16th step-deformed (dark) armchair-mode tensile deformation. The curve plots the presented values ratio when n = 16
practically constant maximum N DA values of the latter, which follows from the
presented equalizing coefficient. Actually, Fig. 16.6 shows the distribution of the
absolute N DA values for the zero and 16th steps alongside with their ratio. As seen
in the figure, the redistribution concerns basal plane atoms mainly, indeed.
Important to draw attention to both the image N DA maps and the corresponding
structures related to the 15th and 16th steps. The structures are drawn by a visualization standard program that is based on tabulated values of the chemical bond
lengths. According to the data, there is one broken C–C bond at the 15th step and
five of them appear at the 16th step. Since the bonds are ruptured homolytically,
one should expect the radicalization of the molecule at these points. Providing the
N DA indicative ability of just the very events, the appearance of white spots on the
maps should be expected. However, until the 17th step no such spots are observed.
This shows that the bonds breaking occurs at much longer interatomic distance in
comparison with the standard tabulated data, which supports the conclusion made
in [42].
Figure 16.7 presents a similar picture describing changes in the odd electron correlation during the zigzag-mode tension of the studied molecule. The first 17 steps
cover the first-stage zigzag-mode deformation and correspond to the first tooth of
the strain-stress and N D -elongation dependences shown in the left-hand top panels
in Figs. 16.3 and 16.4, respectively. In contrast to the previous case, the redistribution of the N DA values occurs quite differently. Although the general image of the
maps is kept up to the 16th step, the appearance of strongly stretched C–C bonds
can be already noticed at the 15th step while a complete bond breaking becomes
absolutely evident at the 17th step only. The effect of the stretched C–C bonds in
the basal plane on the N DA value redistribution is well seen in Fig. 16.8. About 5.5fold changing in the N DA value is characteristic for one of them while edge atoms
preserve only slightly changed N DA values.
295
Fig. 16.6 The histograms of the N DA distribution over the atoms of the naked (5, 5) NGr molecule
related to the non-deformed (light) and the 16th step-deformed (dark) armchair-mode tensile deformation. The curve plots the presented values ratio when n = 16
practically constant maximum N DA values of the latter, which follows from the
presented equalizing coefficient. Actually, Fig. 16.6 shows the distribution of the
absolute N DA values for the zero and 16th steps alongside with their ratio. As seen
in the figure, the redistribution concerns basal plane atoms mainly, indeed.
Important to draw attention to both the image N DA maps and the corresponding
structures related to the 15th and 16th steps. The structures are drawn by a visualization standard program that is based on tabulated values of the chemical bond
lengths. According to the data, there is one broken C–C bond at the 15th step and
five of them appear at the 16th step. Since the bonds are ruptured homolytically,
one should expect the radicalization of the molecule at these points. Providing the
N DA indicative ability of just the very events, the appearance of white spots on the
maps should be expected. However, until the 17th step no such spots are observed.
This shows that the bonds breaking occurs at much longer interatomic distance in
comparison with the standard tabulated data, which supports the conclusion made
in [42].
Figure 16.7 presents a similar picture describing changes in the odd electron correlation during the zigzag-mode tension of the studied molecule. The first 17 steps
cover the first-stage zigzag-mode deformation and correspond to the first tooth of
the strain-stress and N D -elongation dependences shown in the left-hand top panels
in Figs. 16.3 and 16.4, respectively. In contrast to the previous case, the redistribution of the N DA values occurs quite differently. Although the general image of the
maps is kept up to the 16th step, the appearance of strongly stretched C–C bonds
can be already noticed at the 15th step while a complete bond breaking becomes
absolutely evident at the 17th step only. The effect of the stretched C–C bonds in
the basal plane on the N DA value redistribution is well seen in Fig. 16.8. About 5.5fold changing in the N DA value is characteristic for one of them while edge atoms
preserve only slightly changed N DA values.