

13 Visible-Light Photo-Catalytic Activity in Carbon-Doped Perovskite
229
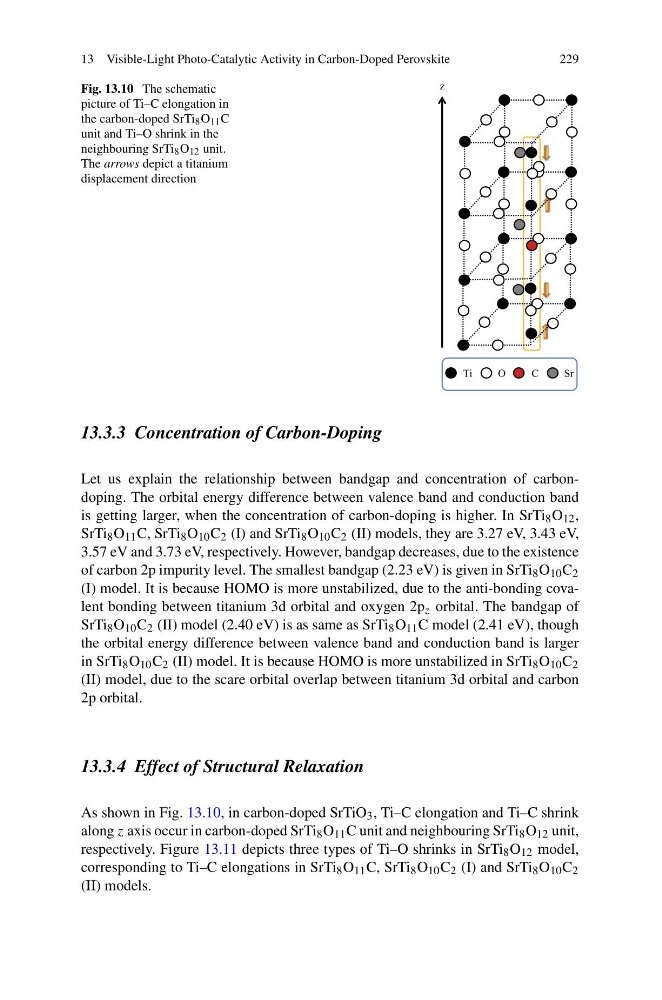
Fig. 13.10 The schematic
picture of Ti–C elongation in
the carbon-doped SrTi 8 O 11 C
unit and Ti–O shrink in the
neighbouring SrTi 8 O 12 unit.
The arrows depict a titanium
displacement direction
13.3.3 Concentration of Carbon-Doping
Let us explain the relationship between bandgap and concentration of carbondoping. The orbital energy difference between valence band and conduction band
is getting larger, when the concentration of carbon-doping is higher. In SrTi 8 O 12 ,
SrTi 8 O 11 C, SrTi 8 O 10 C 2 (I) and SrTi 8 O 10 C 2 (II) models, they are 3.27 eV, 3.43 eV,
3.57 eV and 3.73 eV, respectively. However, bandgap decreases, due to the existence
of carbon 2p impurity level. The smallest bandgap (2.23 eV) is given in SrTi 8 O 10 C 2
(I) model. It is because HOMO is more unstabilized, due to the anti-bonding covalent bonding between titanium 3d orbital and oxygen 2p z orbital. The bandgap of
SrTi 8 O 10 C 2 (II) model (2.40 eV) is as same as SrTi 8 O 11 C model (2.41 eV), though
the orbital energy difference between valence band and conduction band is larger
in SrTi 8 O 10 C 2 (II) model. It is because HOMO is more unstabilized in SrTi 8 O 10 C 2
(II) model, due to the scare orbital overlap between titanium 3d orbital and carbon
2p orbital.
13.3.4 Effect of Structural Relaxation
As shown in Fig. 13.10, in carbon-doped SrTiO 3 , Ti–C elongation and Ti–C shrink
along z axis occur in carbon-doped SrTi 8 O 11 C unit and neighbouring SrTi 8 O 12 unit,
respectively. Figure 13.11 depicts three types of Ti–O shrinks in SrTi 8 O 12 model,
corresponding to Ti–C elongations in SrTi 8 O 11 C, SrTi 8 O 10 C 2 (I) and SrTi 8 O 10 C 2
(II) models.
229
Fig. 13.10 The schematic
picture of Ti–C elongation in
the carbon-doped SrTi 8 O 11 C
unit and Ti–O shrink in the
neighbouring SrTi 8 O 12 unit.
The arrows depict a titanium
displacement direction
13.3.3 Concentration of Carbon-Doping
Let us explain the relationship between bandgap and concentration of carbondoping. The orbital energy difference between valence band and conduction band
is getting larger, when the concentration of carbon-doping is higher. In SrTi 8 O 12 ,
SrTi 8 O 11 C, SrTi 8 O 10 C 2 (I) and SrTi 8 O 10 C 2 (II) models, they are 3.27 eV, 3.43 eV,
3.57 eV and 3.73 eV, respectively. However, bandgap decreases, due to the existence
of carbon 2p impurity level. The smallest bandgap (2.23 eV) is given in SrTi 8 O 10 C 2
(I) model. It is because HOMO is more unstabilized, due to the anti-bonding covalent bonding between titanium 3d orbital and oxygen 2p z orbital. The bandgap of
SrTi 8 O 10 C 2 (II) model (2.40 eV) is as same as SrTi 8 O 11 C model (2.41 eV), though
the orbital energy difference between valence band and conduction band is larger
in SrTi 8 O 10 C 2 (II) model. It is because HOMO is more unstabilized in SrTi 8 O 10 C 2
(II) model, due to the scare orbital overlap between titanium 3d orbital and carbon
2p orbital.
13.3.4 Effect of Structural Relaxation
As shown in Fig. 13.10, in carbon-doped SrTiO 3 , Ti–C elongation and Ti–C shrink
along z axis occur in carbon-doped SrTi 8 O 11 C unit and neighbouring SrTi 8 O 12 unit,
respectively. Figure 13.11 depicts three types of Ti–O shrinks in SrTi 8 O 12 model,
corresponding to Ti–C elongations in SrTi 8 O 11 C, SrTi 8 O 10 C 2 (I) and SrTi 8 O 10 C 2
(II) models.