

13 Visible-Light Photo-Catalytic Activity in Carbon-Doped Perovskite
227
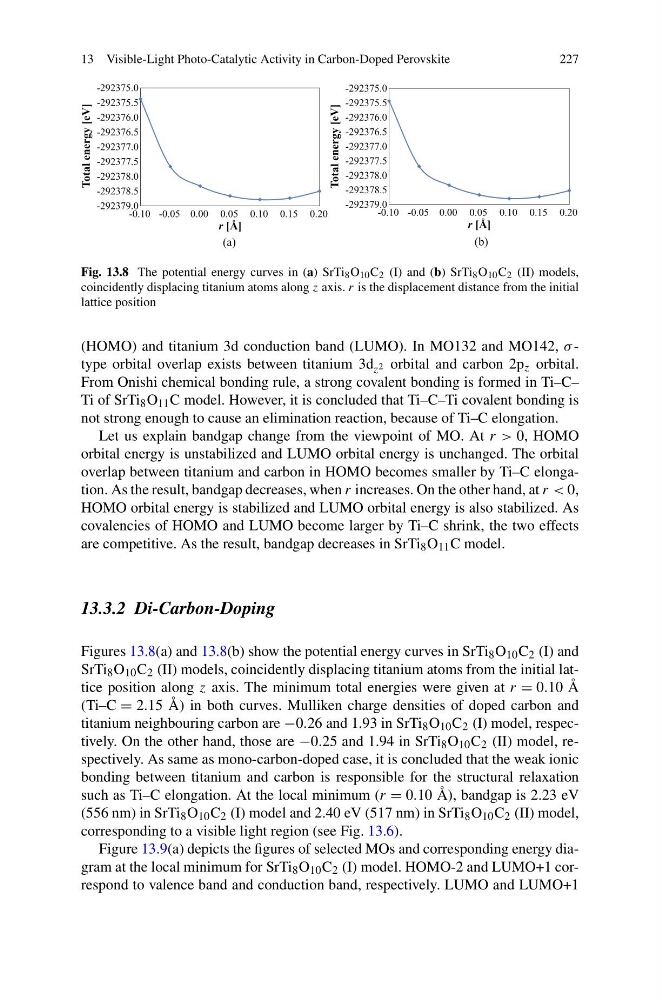
Fig. 13.8 The potential energy curves in (a) SrTi 8 O 10 C 2 (I) and (b) SrTi 8 O 10 C 2 (II) models,
coincidently displacing titanium atoms along z axis. r is the displacement distance from the initial
lattice position
(HOMO) and titanium 3d conduction band (LUMO). In MO132 and MO142, σ -
type orbital overlap exists between titanium 3d z 2 orbital and carbon 2p z orbital.
From Onishi chemical bonding rule, a strong covalent bonding is formed in Ti–C–
Ti of SrTi 8 O 11 C model. However, it is concluded that Ti–C–Ti covalent bonding is
not strong enough to cause an elimination reaction, because of Ti–C elongation.
Let us explain bandgap change from the viewpoint of MO. At r > 0, HOMO
orbital energy is unstabilized and LUMO orbital energy is unchanged. The orbital
overlap between titanium and carbon in HOMO becomes smaller by Ti–C elongation. As the result, bandgap decreases, when r increases. On the other hand, at r < 0,
HOMO orbital energy is stabilized and LUMO orbital energy is also stabilized. As
covalencies of HOMO and LUMO become larger by Ti–C shrink, the two effects
are competitive. As the result, bandgap decreases in SrTi 8 O 11 C model.
13.3.2 Di-Carbon-Doping
Figures 13.8(a) and 13.8(b) show the potential energy curves in SrTi 8 O 10 C 2 (I) and
SrTi 8 O 10 C 2 (II) models, coincidently displacing titanium atoms from the initial lattice position along z axis. The minimum total energies were given at r = 0.10 Å
(Ti–C = 2.15 Å) in both curves. Mulliken charge densities of doped carbon and
titanium neighbouring carbon are −0.26 and 1.93 in SrTi 8 O 10 C 2 (I) model, respectively. On the other hand, those are −0.25 and 1.94 in SrTi 8 O 10 C 2 (II) model, respectively. As same as mono-carbon-doped case, it is concluded that the weak ionic
bonding between titanium and carbon is responsible for the structural relaxation
such as Ti–C elongation. At the local minimum (r = 0.10 Å), bandgap is 2.23 eV
(556 nm) in SrTi 8 O 10 C 2 (I) model and 2.40 eV (517 nm) in SrTi 8 O 10 C 2 (II) model,
corresponding to a visible light region (see Fig. 13.6).
Figure 13.9(a) depicts the figures of selected MOs and corresponding energy diagram at the local minimum for SrTi 8 O 10 C 2 (I) model. HOMO-2 and LUMO+1 correspond to valence band and conduction band, respectively. LUMO and LUMO+1
227
Fig. 13.8 The potential energy curves in (a) SrTi 8 O 10 C 2 (I) and (b) SrTi 8 O 10 C 2 (II) models,
coincidently displacing titanium atoms along z axis. r is the displacement distance from the initial
lattice position
(HOMO) and titanium 3d conduction band (LUMO). In MO132 and MO142, σ -
type orbital overlap exists between titanium 3d z 2 orbital and carbon 2p z orbital.
From Onishi chemical bonding rule, a strong covalent bonding is formed in Ti–C–
Ti of SrTi 8 O 11 C model. However, it is concluded that Ti–C–Ti covalent bonding is
not strong enough to cause an elimination reaction, because of Ti–C elongation.
Let us explain bandgap change from the viewpoint of MO. At r > 0, HOMO
orbital energy is unstabilized and LUMO orbital energy is unchanged. The orbital
overlap between titanium and carbon in HOMO becomes smaller by Ti–C elongation. As the result, bandgap decreases, when r increases. On the other hand, at r < 0,
HOMO orbital energy is stabilized and LUMO orbital energy is also stabilized. As
covalencies of HOMO and LUMO become larger by Ti–C shrink, the two effects
are competitive. As the result, bandgap decreases in SrTi 8 O 11 C model.
13.3.2 Di-Carbon-Doping
Figures 13.8(a) and 13.8(b) show the potential energy curves in SrTi 8 O 10 C 2 (I) and
SrTi 8 O 10 C 2 (II) models, coincidently displacing titanium atoms from the initial lattice position along z axis. The minimum total energies were given at r = 0.10 Å
(Ti–C = 2.15 Å) in both curves. Mulliken charge densities of doped carbon and
titanium neighbouring carbon are −0.26 and 1.93 in SrTi 8 O 10 C 2 (I) model, respectively. On the other hand, those are −0.25 and 1.94 in SrTi 8 O 10 C 2 (II) model, respectively. As same as mono-carbon-doped case, it is concluded that the weak ionic
bonding between titanium and carbon is responsible for the structural relaxation
such as Ti–C elongation. At the local minimum (r = 0.10 Å), bandgap is 2.23 eV
(556 nm) in SrTi 8 O 10 C 2 (I) model and 2.40 eV (517 nm) in SrTi 8 O 10 C 2 (II) model,
corresponding to a visible light region (see Fig. 13.6).
Figure 13.9(a) depicts the figures of selected MOs and corresponding energy diagram at the local minimum for SrTi 8 O 10 C 2 (I) model. HOMO-2 and LUMO+1 correspond to valence band and conduction band, respectively. LUMO and LUMO+1