

226
T. Onishi
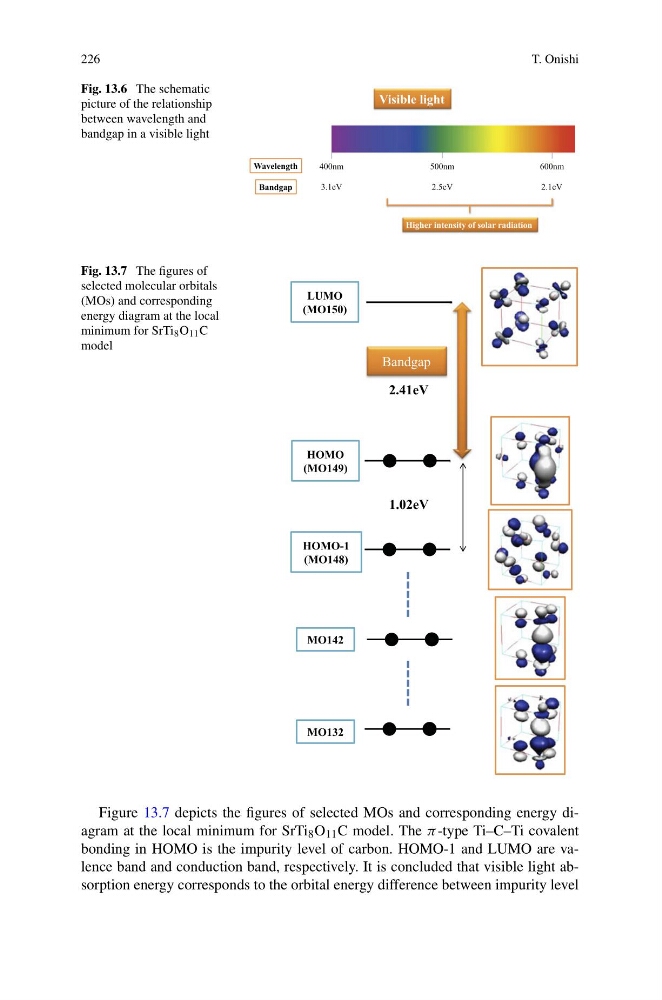
Fig. 13.6 The schematic
picture of the relationship
between wavelength and
bandgap in a visible light
Fig. 13.7 The figures of
selected molecular orbitals
(MOs) and corresponding
energy diagram at the local
minimum for SrTi 8 O 11 C
model
Figure 13.7 depicts the figures of selected MOs and corresponding energy diagram at the local minimum for SrTi 8 O 11 C model. The π -type Ti–C–Ti covalent
bonding in HOMO is the impurity level of carbon. HOMO-1 and LUMO are valence band and conduction band, respectively. It is concluded that visible light absorption energy corresponds to the orbital energy difference between impurity level
T. Onishi
Fig. 13.6 The schematic
picture of the relationship
between wavelength and
bandgap in a visible light
Fig. 13.7 The figures of
selected molecular orbitals
(MOs) and corresponding
energy diagram at the local
minimum for SrTi 8 O 11 C
model
Figure 13.7 depicts the figures of selected MOs and corresponding energy diagram at the local minimum for SrTi 8 O 11 C model. The π -type Ti–C–Ti covalent
bonding in HOMO is the impurity level of carbon. HOMO-1 and LUMO are valence band and conduction band, respectively. It is concluded that visible light absorption energy corresponds to the orbital energy difference between impurity level