

13 Visible-Light Photo-Catalytic Activity in Carbon-Doped Perovskite
225
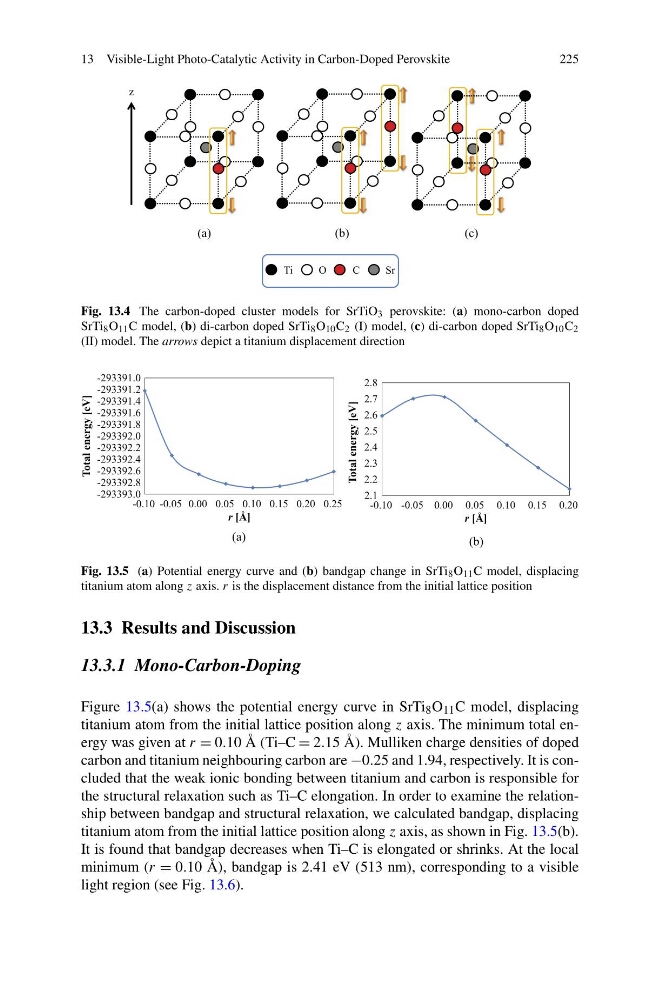
Fig. 13.4 The carbon-doped cluster models for SrTiO 3 perovskite: (a) mono-carbon doped
SrTi 8 O 11 C model, (b) di-carbon doped SrTi 8 O 10 C 2 (I) model, (c) di-carbon doped SrTi 8 O 10 C 2
(II) model. The arrows depict a titanium displacement direction
Fig. 13.5 (a) Potential energy curve and (b) bandgap change in SrTi 8 O 11 C model, displacing
titanium atom along z axis. r is the displacement distance from the initial lattice position
13.3 Results and Discussion
13.3.1 Mono-Carbon-Doping
Figure 13.5(a) shows the potential energy curve in SrTi 8 O 11 C model, displacing
titanium atom from the initial lattice position along z axis. The minimum total energy was given at r = 0.10 Å (Ti–C = 2.15 Å). Mulliken charge densities of doped
carbon and titanium neighbouring carbon are −0.25 and 1.94, respectively. It is concluded that the weak ionic bonding between titanium and carbon is responsible for
the structural relaxation such as Ti–C elongation. In order to examine the relationship between bandgap and structural relaxation, we calculated bandgap, displacing
titanium atom from the initial lattice position along z axis, as shown in Fig. 13.5(b).
It is found that bandgap decreases when Ti–C is elongated or shrinks. At the local
minimum (r = 0.10 Å), bandgap is 2.41 eV (513 nm), corresponding to a visible
light region (see Fig. 13.6).
225
Fig. 13.4 The carbon-doped cluster models for SrTiO 3 perovskite: (a) mono-carbon doped
SrTi 8 O 11 C model, (b) di-carbon doped SrTi 8 O 10 C 2 (I) model, (c) di-carbon doped SrTi 8 O 10 C 2
(II) model. The arrows depict a titanium displacement direction
Fig. 13.5 (a) Potential energy curve and (b) bandgap change in SrTi 8 O 11 C model, displacing
titanium atom along z axis. r is the displacement distance from the initial lattice position
13.3 Results and Discussion
13.3.1 Mono-Carbon-Doping
Figure 13.5(a) shows the potential energy curve in SrTi 8 O 11 C model, displacing
titanium atom from the initial lattice position along z axis. The minimum total energy was given at r = 0.10 Å (Ti–C = 2.15 Å). Mulliken charge densities of doped
carbon and titanium neighbouring carbon are −0.25 and 1.94, respectively. It is concluded that the weak ionic bonding between titanium and carbon is responsible for
the structural relaxation such as Ti–C elongation. In order to examine the relationship between bandgap and structural relaxation, we calculated bandgap, displacing
titanium atom from the initial lattice position along z axis, as shown in Fig. 13.5(b).
It is found that bandgap decreases when Ti–C is elongated or shrinks. At the local
minimum (r = 0.10 Å), bandgap is 2.41 eV (513 nm), corresponding to a visible
light region (see Fig. 13.6).