

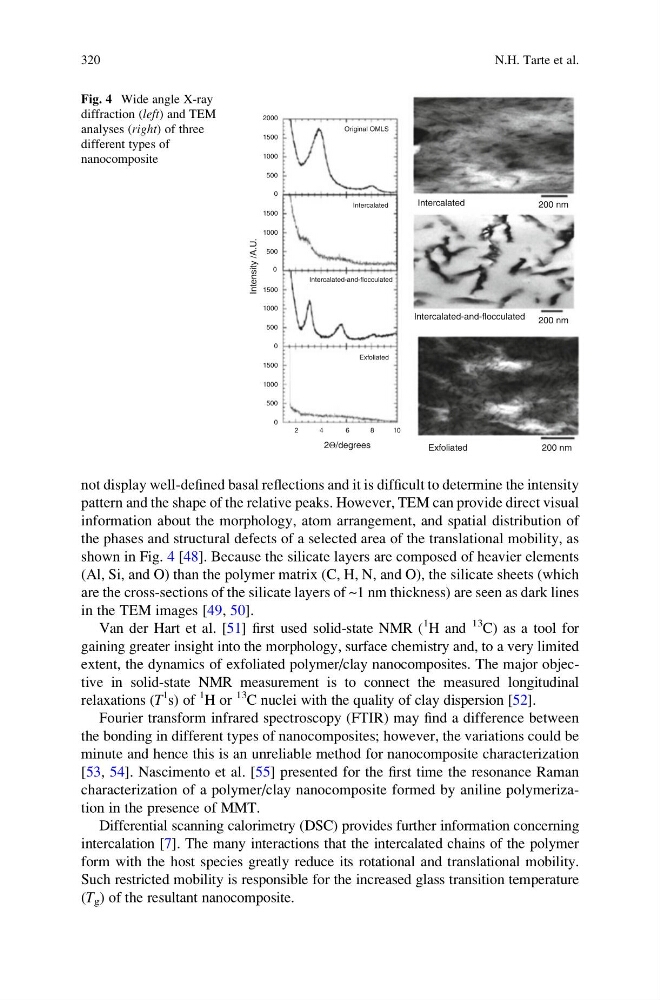
not display well-defined basal reflections and it is difficult to determine the intensity
pattern and the shape of the relative peaks. However, TEM can provide direct visual
information about the morphology, atom arrangement, and spatial distribution of
the phases and structural defects of a selected area of the translational mobility, as
shown in Fig. 4 [48]. Because the silicate layers are composed of heavier elements
(Al, Si, and O) than the polymer matrix (C, H, N, and O), the silicate sheets (which
are the cross-sections of the silicate layers of ~1 nm thickness) are seen as dark lines
in the TEM images [49, 50].
Van der Hart et al. [51] first used solid-state NMR (
1
H and
13
C) as a tool for
gaining greater insight into the morphology, surface chemistry and, to a very limited
extent, the dynamics of exfoliated polymer/clay nanocomposites. The major objective in solid-state NMR measurement is to connect the measured longitudinal
relaxations (T
1
s) of
1
H or
13
C nuclei with the quality of clay dispersion [52].
Fourier transform infrared spectroscopy (FTIR) may find a difference between
the bonding in different types of nanocomposites; however, the variations could be
minute and hence this is an unreliable method for nanocomposite characterization
[53, 54]. Nascimento et al. [55] presented for the first time the resonance Raman
characterization of a polymer/clay nanocomposite formed by aniline polymerization in the presence of MMT.
Differential scanning calorimetry (DSC) provides further information concerning
intercalation [7]. The many interactions that the intercalated chains of the polymer
form with the host species greatly reduce its rotational and translational mobility.
Such restricted mobility is responsible for the increased glass transition temperature
(T g ) of the resultant nanocomposite.
2000
1500
1500
1500
1500
1000
1000
1000
1000
500
500
500
500
0
0
0
0
Intensity /A.U.
Original OMLS
Intercalated
Intercalated
Intercalated-and-flocculated
Intercalated-and-flocculated
Exfoliated
Exfoliated
2
4
6
8
1 0
2Θ/degrees
200 nm
200 nm
200 nm
Fig. 4 Wide angle X-ray
diffraction (left) and TEM
analyses (right) of three
different types of
nanocomposite
320
N.H. Tarte et al.
pattern and the shape of the relative peaks. However, TEM can provide direct visual
information about the morphology, atom arrangement, and spatial distribution of
the phases and structural defects of a selected area of the translational mobility, as
shown in Fig. 4 [48]. Because the silicate layers are composed of heavier elements
(Al, Si, and O) than the polymer matrix (C, H, N, and O), the silicate sheets (which
are the cross-sections of the silicate layers of ~1 nm thickness) are seen as dark lines
in the TEM images [49, 50].
Van der Hart et al. [51] first used solid-state NMR (
1
H and
13
C) as a tool for
gaining greater insight into the morphology, surface chemistry and, to a very limited
extent, the dynamics of exfoliated polymer/clay nanocomposites. The major objective in solid-state NMR measurement is to connect the measured longitudinal
relaxations (T
1
s) of
1
H or
13
C nuclei with the quality of clay dispersion [52].
Fourier transform infrared spectroscopy (FTIR) may find a difference between
the bonding in different types of nanocomposites; however, the variations could be
minute and hence this is an unreliable method for nanocomposite characterization
[53, 54]. Nascimento et al. [55] presented for the first time the resonance Raman
characterization of a polymer/clay nanocomposite formed by aniline polymerization in the presence of MMT.
Differential scanning calorimetry (DSC) provides further information concerning
intercalation [7]. The many interactions that the intercalated chains of the polymer
form with the host species greatly reduce its rotational and translational mobility.
Such restricted mobility is responsible for the increased glass transition temperature
(T g ) of the resultant nanocomposite.
2000
1500
1500
1500
1500
1000
1000
1000
1000
500
500
500
500
0
0
0
0
Intensity /A.U.
Original OMLS
Intercalated
Intercalated
Intercalated-and-flocculated
Intercalated-and-flocculated
Exfoliated
Exfoliated
2
4
6
8
1 0
2Θ/degrees
200 nm
200 nm
200 nm
Fig. 4 Wide angle X-ray
diffraction (left) and TEM
analyses (right) of three
different types of
nanocomposite
320
N.H. Tarte et al.