

5 Techniques Used for the Characterization
of Nanocomposites
Generally, the structure of nanocomposites has typically been established using
XRD and transmission electron microscopy (TEM) observation. The XRD
diffractograms and related TEM images produced by different types of hybrid are
illustrated in Fig. 4 [21].
Using XRD, one can determine the spaces between silicate layers using Bragg’s
law: sinθ ¼ nλ/2d, where λ corresponds to the wavelength of the X-ray radiation
used, d the spacing between diffractional lattice planes and θ is the measured
diffraction angle or glancing angle [9]. Hence, following Bragg’s law, intercalation
of the polymer chains increases the interlayer spacing, leading to a shift of the
diffraction peak towards a lower angle. In the intercalated nanocomposites, the
repetitive multilayer structure is well preserved, allowing the interlayer spacing to
be determined; however, the exfoliated structures disrupt the coherent layer
stacking, resulting in a featureless diffraction pattern. Thus, for exfoliated
structures no more diffraction peaks are visible in the XRD diffractograms either
because of a much too large spacing between the layers or due to a highly
disordered nanocomposite structure [21, 46, 47].
XRD does not provide information concerning the spatial distribution of the
silicate in the polymer matrix, nor the shape of the hybrid, since all its data are
“averaged” over the whole of the sample. Furthermore, some layered silicates do
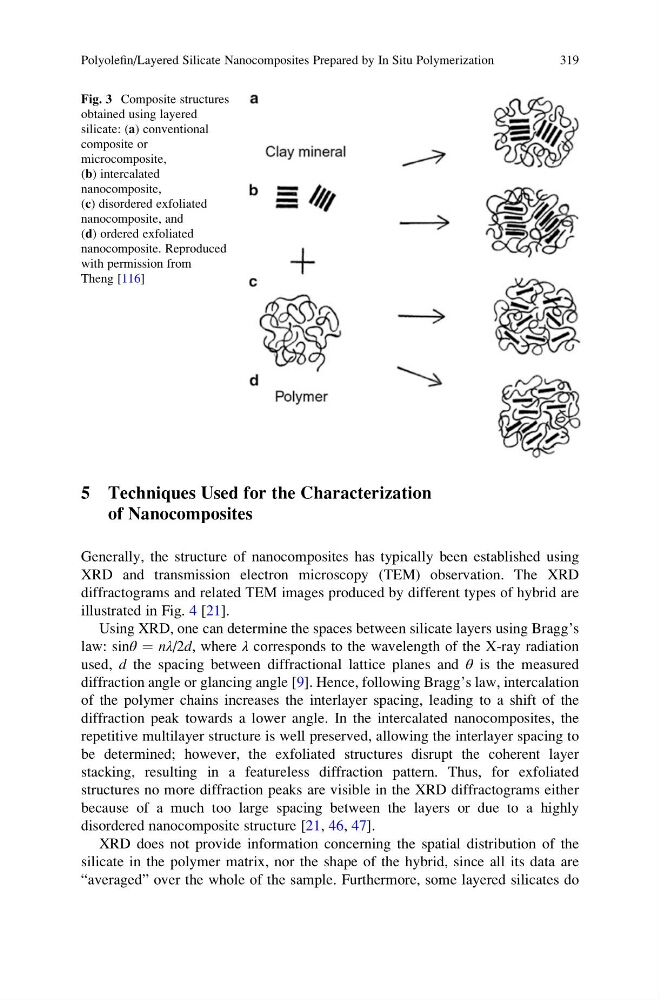
Fig. 3 Composite structures
obtained using layered
silicate: (a) conventional
composite or
microcomposite,
(b) intercalated
nanocomposite,
(c) disordered exfoliated
nanocomposite, and
(d) ordered exfoliated
nanocomposite. Reproduced
with permission from
Theng [116]
Polyolefin/Layered Silicate Nanocomposites Prepared by In Situ Polymerization
319
of Nanocomposites
Generally, the structure of nanocomposites has typically been established using
XRD and transmission electron microscopy (TEM) observation. The XRD
diffractograms and related TEM images produced by different types of hybrid are
illustrated in Fig. 4 [21].
Using XRD, one can determine the spaces between silicate layers using Bragg’s
law: sinθ ¼ nλ/2d, where λ corresponds to the wavelength of the X-ray radiation
used, d the spacing between diffractional lattice planes and θ is the measured
diffraction angle or glancing angle [9]. Hence, following Bragg’s law, intercalation
of the polymer chains increases the interlayer spacing, leading to a shift of the
diffraction peak towards a lower angle. In the intercalated nanocomposites, the
repetitive multilayer structure is well preserved, allowing the interlayer spacing to
be determined; however, the exfoliated structures disrupt the coherent layer
stacking, resulting in a featureless diffraction pattern. Thus, for exfoliated
structures no more diffraction peaks are visible in the XRD diffractograms either
because of a much too large spacing between the layers or due to a highly
disordered nanocomposite structure [21, 46, 47].
XRD does not provide information concerning the spatial distribution of the
silicate in the polymer matrix, nor the shape of the hybrid, since all its data are
“averaged” over the whole of the sample. Furthermore, some layered silicates do
Fig. 3 Composite structures
obtained using layered
silicate: (a) conventional
composite or
microcomposite,
(b) intercalated
nanocomposite,
(c) disordered exfoliated
nanocomposite, and
(d) ordered exfoliated
nanocomposite. Reproduced
with permission from
Theng [116]
Polyolefin/Layered Silicate Nanocomposites Prepared by In Situ Polymerization
319