

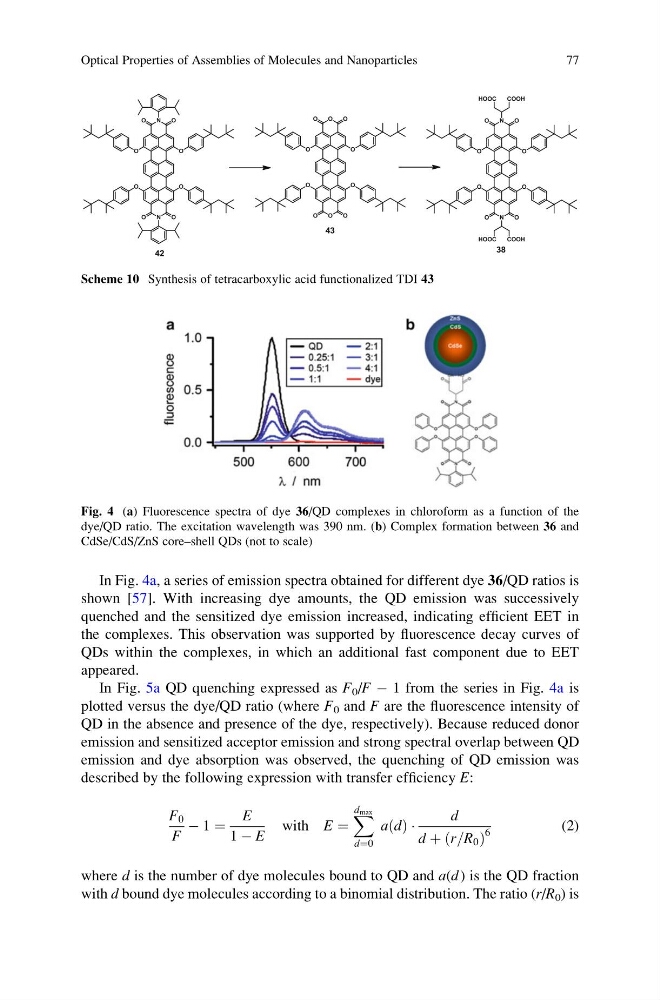
In Fig. 4a, a series of emission spectra obtained for different dye 36/QD ratios is
shown [57]. With increasing dye amounts, the QD emission was successively
quenched and the sensitized dye emission increased, indicating efficient EET in
the complexes. This observation was supported by fluorescence decay curves of
QDs within the complexes, in which an additional fast component due to EET
appeared.
In Fig. 5a QD quenching expressed as F 0 /F À 1 from the series in Fig. 4a is
plotted versus the dye/QD ratio (where F 0 and F are the fluorescence intensity of
QD in the absence and presence of the dye, respectively). Because reduced donor
emission and sensitized acceptor emission and strong spectral overlap between QD
emission and dye absorption was observed, the quenching of QD emission was
described by the following expression with transfer efficiency E:
F 0
F
À 1 ¼
E
1 À E
with E ¼
X d max
d¼0
a d
ð Þ Á
d
d þ r=R 0
ð
Þ
6
(2)
where d is the number of dye molecules bound to QD and a(d ) is the QD fraction
with d bound dye molecules according to a binomial distribution. The ratio (r/R 0 ) is
Scheme 10 Synthesis of tetracarboxylic acid functionalized TDI 43
Fig. 4 (a) Fluorescence spectra of dye 36/QD complexes in chloroform as a function of the
dye/QD ratio. The excitation wavelength was 390 nm. (b) Complex formation between 36 and
CdSe/CdS/ZnS core–shell QDs (not to scale)
Optical Properties of Assemblies of Molecules and Nanoparticles
77
shown [57]. With increasing dye amounts, the QD emission was successively
quenched and the sensitized dye emission increased, indicating efficient EET in
the complexes. This observation was supported by fluorescence decay curves of
QDs within the complexes, in which an additional fast component due to EET
appeared.
In Fig. 5a QD quenching expressed as F 0 /F À 1 from the series in Fig. 4a is
plotted versus the dye/QD ratio (where F 0 and F are the fluorescence intensity of
QD in the absence and presence of the dye, respectively). Because reduced donor
emission and sensitized acceptor emission and strong spectral overlap between QD
emission and dye absorption was observed, the quenching of QD emission was
described by the following expression with transfer efficiency E:
F 0
F
À 1 ¼
E
1 À E
with E ¼
X d max
d¼0
a d
ð Þ Á
d
d þ r=R 0
ð
Þ
6
(2)
where d is the number of dye molecules bound to QD and a(d ) is the QD fraction
with d bound dye molecules according to a binomial distribution. The ratio (r/R 0 ) is
Scheme 10 Synthesis of tetracarboxylic acid functionalized TDI 43
Fig. 4 (a) Fluorescence spectra of dye 36/QD complexes in chloroform as a function of the
dye/QD ratio. The excitation wavelength was 390 nm. (b) Complex formation between 36 and
CdSe/CdS/ZnS core–shell QDs (not to scale)
Optical Properties of Assemblies of Molecules and Nanoparticles
77