

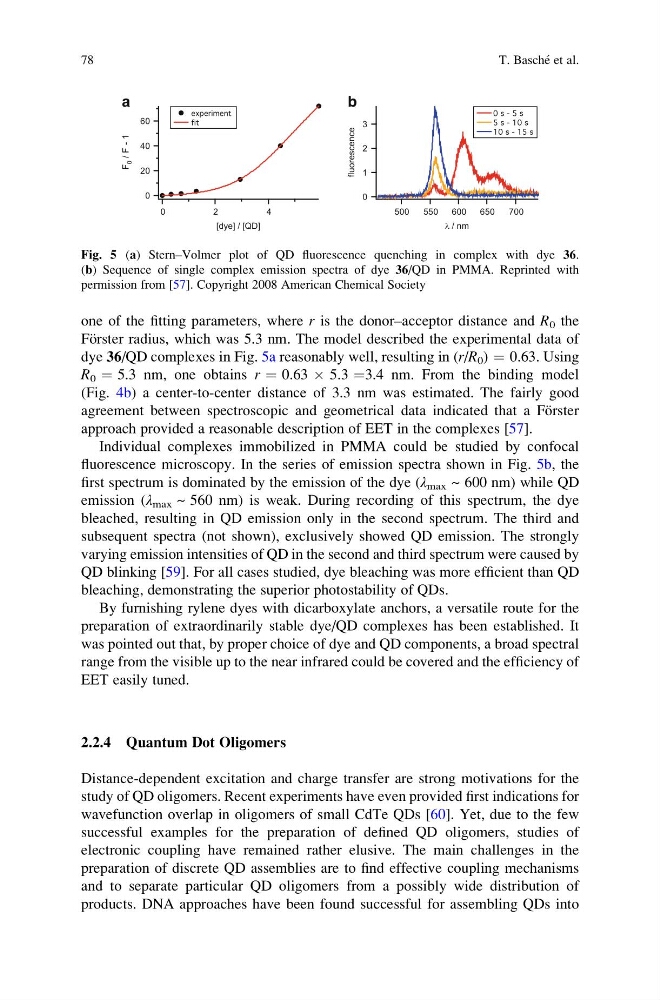
one of the fitting parameters, where r is the donor–acceptor distance and R 0 the
Fo ¨rster radius, which was 5.3 nm. The model described the experimental data of
dye 36/QD complexes in Fig. 5a reasonably well, resulting in (r/R 0 ) ¼ 0.63. Using
R 0 ¼ 5.3 nm, one obtains r ¼ 0.63 Â 5.3 ¼3.4 nm. From the binding model
(Fig. 4b) a center-to-center distance of 3.3 nm was estimated. The fairly good
agreement between spectroscopic and geometrical data indicated that a Fo ¨rster
approach provided a reasonable description of EET in the complexes [57].
Individual complexes immobilized in PMMA could be studied by confocal
fluorescence microscopy. In the series of emission spectra shown in Fig. 5b, the
first spectrum is dominated by the emission of the dye (λ max ~ 600 nm) while QD
emission (λ max ~ 560 nm) is weak. During recording of this spectrum, the dye
bleached, resulting in QD emission only in the second spectrum. The third and
subsequent spectra (not shown), exclusively showed QD emission. The strongly
varying emission intensities of QD in the second and third spectrum were caused by
QD blinking [59]. For all cases studied, dye bleaching was more efficient than QD
bleaching, demonstrating the superior photostability of QDs.
By furnishing rylene dyes with dicarboxylate anchors, a versatile route for the
preparation of extraordinarily stable dye/QD complexes has been established. It
was pointed out that, by proper choice of dye and QD components, a broad spectral
range from the visible up to the near infrared could be covered and the efficiency of
EET easily tuned.
2.2.4 Quantum Dot Oligomers
Distance-dependent excitation and charge transfer are strong motivations for the
study of QD oligomers. Recent experiments have even provided first indications for
wavefunction overlap in oligomers of small CdTe QDs [60]. Yet, due to the few
successful examples for the preparation of defined QD oligomers, studies of
electronic coupling have remained rather elusive. The main challenges in the
preparation of discrete QD assemblies are to find effective coupling mechanisms
and to separate particular QD oligomers from a possibly wide distribution of
products. DNA approaches have been found successful for assembling QDs into
3
2
1
0
fluorescence
700
650
600
550
500
l / nm
0 s - 5 s
5 s - 10 s
10 s - 15 s
60
40
20
0
F
0 / F - 1
4
2
0
[dye] / [QD]
experiment
fit
a
b
Fig. 5 (a) Stern–Volmer plot of QD fluorescence quenching in complex with dye 36.
(b) Sequence of single complex emission spectra of dye 36/QD in PMMA. Reprinted with
permission from [57]. Copyright 2008 American Chemical Society
78
T. Basche ´ et al.
Fo ¨rster radius, which was 5.3 nm. The model described the experimental data of
dye 36/QD complexes in Fig. 5a reasonably well, resulting in (r/R 0 ) ¼ 0.63. Using
R 0 ¼ 5.3 nm, one obtains r ¼ 0.63 Â 5.3 ¼3.4 nm. From the binding model
(Fig. 4b) a center-to-center distance of 3.3 nm was estimated. The fairly good
agreement between spectroscopic and geometrical data indicated that a Fo ¨rster
approach provided a reasonable description of EET in the complexes [57].
Individual complexes immobilized in PMMA could be studied by confocal
fluorescence microscopy. In the series of emission spectra shown in Fig. 5b, the
first spectrum is dominated by the emission of the dye (λ max ~ 600 nm) while QD
emission (λ max ~ 560 nm) is weak. During recording of this spectrum, the dye
bleached, resulting in QD emission only in the second spectrum. The third and
subsequent spectra (not shown), exclusively showed QD emission. The strongly
varying emission intensities of QD in the second and third spectrum were caused by
QD blinking [59]. For all cases studied, dye bleaching was more efficient than QD
bleaching, demonstrating the superior photostability of QDs.
By furnishing rylene dyes with dicarboxylate anchors, a versatile route for the
preparation of extraordinarily stable dye/QD complexes has been established. It
was pointed out that, by proper choice of dye and QD components, a broad spectral
range from the visible up to the near infrared could be covered and the efficiency of
EET easily tuned.
2.2.4 Quantum Dot Oligomers
Distance-dependent excitation and charge transfer are strong motivations for the
study of QD oligomers. Recent experiments have even provided first indications for
wavefunction overlap in oligomers of small CdTe QDs [60]. Yet, due to the few
successful examples for the preparation of defined QD oligomers, studies of
electronic coupling have remained rather elusive. The main challenges in the
preparation of discrete QD assemblies are to find effective coupling mechanisms
and to separate particular QD oligomers from a possibly wide distribution of
products. DNA approaches have been found successful for assembling QDs into
3
2
1
0
fluorescence
700
650
600
550
500
l / nm
0 s - 5 s
5 s - 10 s
10 s - 15 s
60
40
20
0
F
0 / F - 1
4
2
0
[dye] / [QD]
experiment
fit
a
b
Fig. 5 (a) Stern–Volmer plot of QD fluorescence quenching in complex with dye 36.
(b) Sequence of single complex emission spectra of dye 36/QD in PMMA. Reprinted with
permission from [57]. Copyright 2008 American Chemical Society
78
T. Basche ´ et al.