

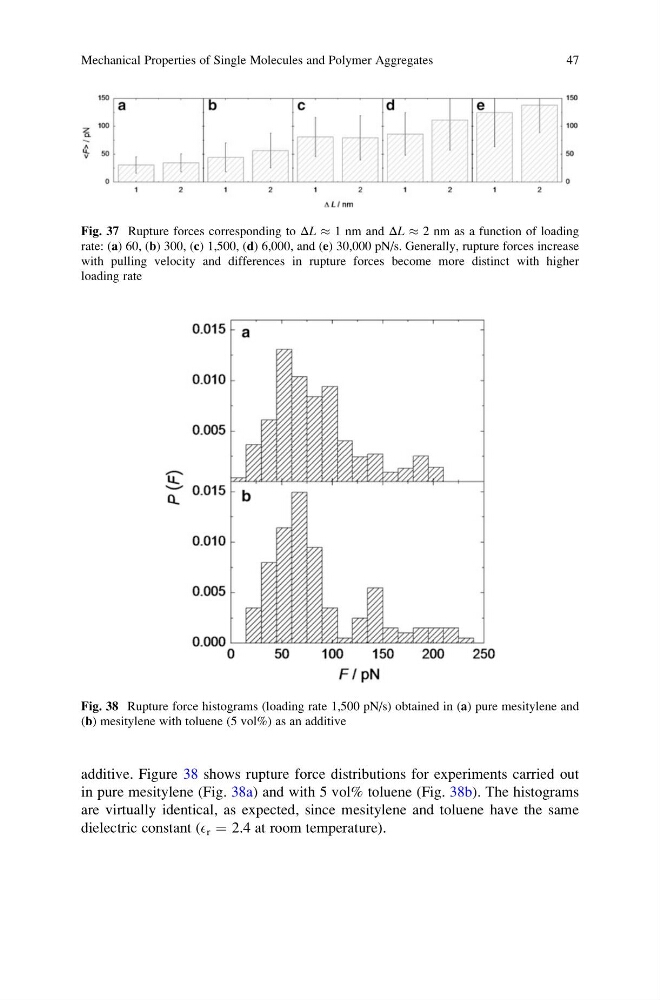
additive. Figure 38 shows rupture force distributions for experiments carried out
in pure mesitylene (Fig. 38a) and with 5 vol% toluene (Fig. 38b). The histograms
are virtually identical, as expected, since mesitylene and toluene have the same
dielectric constant (E r ¼ 2.4 at room temperature).
Fig. 37 Rupture forces corresponding to ΔL % 1 nm and ΔL % 2 nm as a function of loading
rate: (a) 60, (b) 300, (c) 1,500, (d) 6,000, and (e) 30,000 pN/s. Generally, rupture forces increase
with pulling velocity and differences in rupture forces become more distinct with higher
loading rate
Fig. 38 Rupture force histograms (loading rate 1,500 pN/s) obtained in (a) pure mesitylene and
(b) mesitylene with toluene (5 vol%) as an additive
Mechanical Properties of Single Molecules and Polymer Aggregates
47
in pure mesitylene (Fig. 38a) and with 5 vol% toluene (Fig. 38b). The histograms
are virtually identical, as expected, since mesitylene and toluene have the same
dielectric constant (E r ¼ 2.4 at room temperature).
Fig. 37 Rupture forces corresponding to ΔL % 1 nm and ΔL % 2 nm as a function of loading
rate: (a) 60, (b) 300, (c) 1,500, (d) 6,000, and (e) 30,000 pN/s. Generally, rupture forces increase
with pulling velocity and differences in rupture forces become more distinct with higher
loading rate
Fig. 38 Rupture force histograms (loading rate 1,500 pN/s) obtained in (a) pure mesitylene and
(b) mesitylene with toluene (5 vol%) as an additive
Mechanical Properties of Single Molecules and Polymer Aggregates
47