

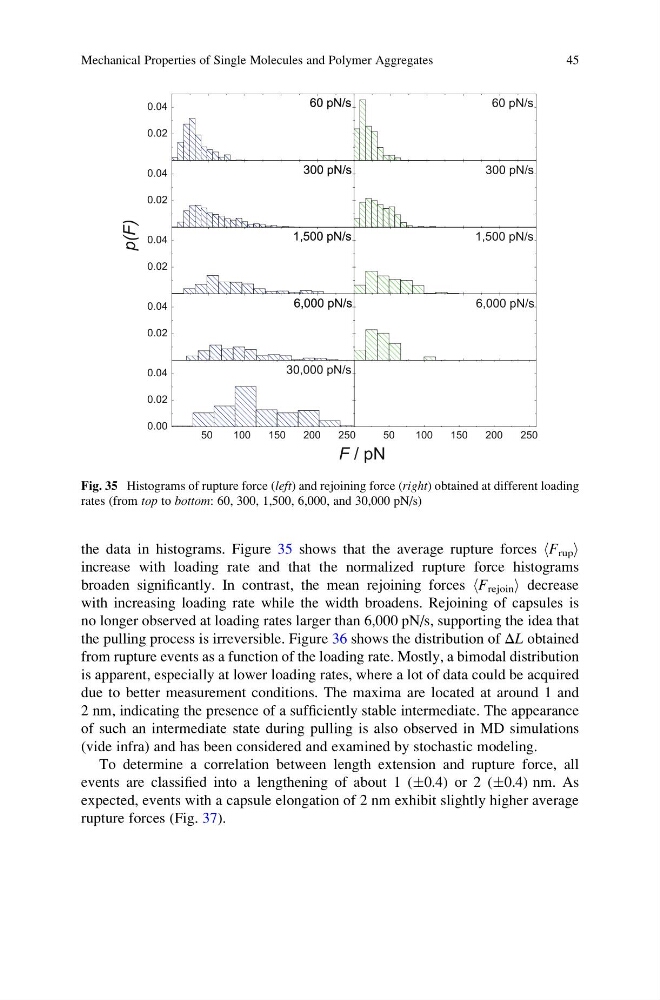
the data in histograms. Figure 35 shows that the average rupture forces hF rup i
increase with loading rate and that the normalized rupture force histograms
broaden significantly. In contrast, the mean rejoining forces hF rejoin i decrease
with increasing loading rate while the width broadens. Rejoining of capsules is
no longer observed at loading rates larger than 6,000 pN/s, supporting the idea that
the pulling process is irreversible. Figure 36 shows the distribution of ΔL obtained
from rupture events as a function of the loading rate. Mostly, a bimodal distribution
is apparent, especially at lower loading rates, where a lot of data could be acquired
due to better measurement conditions. The maxima are located at around 1 and
2 nm, indicating the presence of a sufficiently stable intermediate. The appearance
of such an intermediate state during pulling is also observed in MD simulations
(vide infra) and has been considered and examined by stochastic modeling.
To determine a correlation between length extension and rupture force, all
events are classified into a lengthening of about 1 (Æ0.4) or 2 (Æ0.4) nm. As
expected, events with a capsule elongation of 2 nm exhibit slightly higher average
rupture forces (Fig. 37).
Fig. 35 Histograms of rupture force (left) and rejoining force (right) obtained at different loading
rates (from top to bottom: 60, 300, 1,500, 6,000, and 30,000 pN/s)
Mechanical Properties of Single Molecules and Polymer Aggregates
45
increase with loading rate and that the normalized rupture force histograms
broaden significantly. In contrast, the mean rejoining forces hF rejoin i decrease
with increasing loading rate while the width broadens. Rejoining of capsules is
no longer observed at loading rates larger than 6,000 pN/s, supporting the idea that
the pulling process is irreversible. Figure 36 shows the distribution of ΔL obtained
from rupture events as a function of the loading rate. Mostly, a bimodal distribution
is apparent, especially at lower loading rates, where a lot of data could be acquired
due to better measurement conditions. The maxima are located at around 1 and
2 nm, indicating the presence of a sufficiently stable intermediate. The appearance
of such an intermediate state during pulling is also observed in MD simulations
(vide infra) and has been considered and examined by stochastic modeling.
To determine a correlation between length extension and rupture force, all
events are classified into a lengthening of about 1 (Æ0.4) or 2 (Æ0.4) nm. As
expected, events with a capsule elongation of 2 nm exhibit slightly higher average
rupture forces (Fig. 37).
Fig. 35 Histograms of rupture force (left) and rejoining force (right) obtained at different loading
rates (from top to bottom: 60, 300, 1,500, 6,000, and 30,000 pN/s)
Mechanical Properties of Single Molecules and Polymer Aggregates
45