

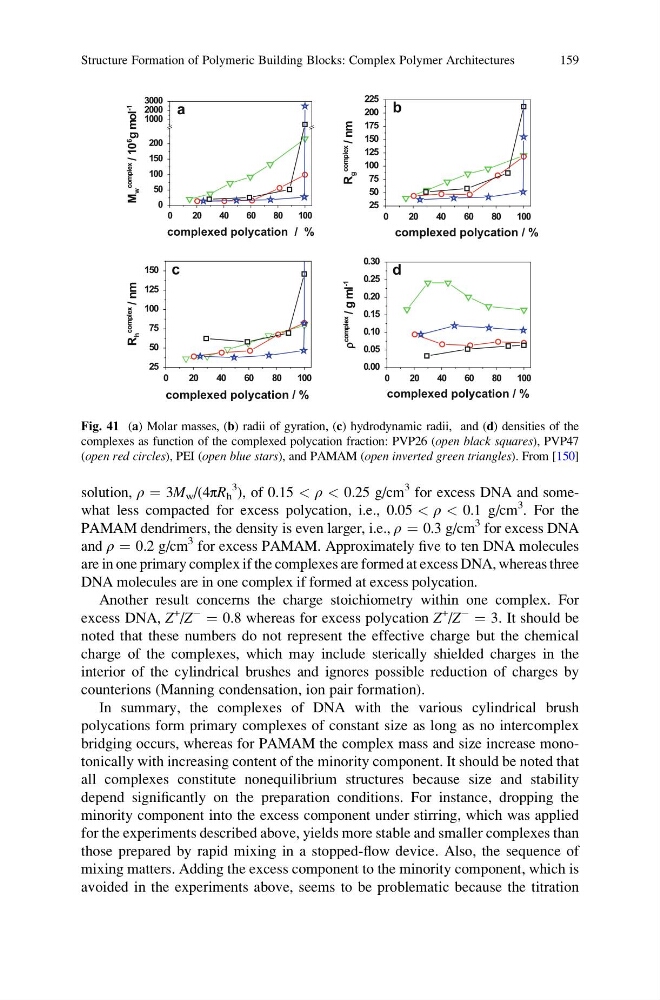
solution, ρ ¼ 3M w /(4πR h
3
), of 0.15 < ρ < 0.25 g/cm
3 for excess DNA and somewhat less compacted for excess polycation, i.e., 0.05 < ρ < 0.1 g/cm
3
. For the
PAMAM dendrimers, the density is even larger, i.e., ρ ¼ 0.3 g/cm
3 for excess DNA
and ρ ¼ 0.2 g/cm
3 for excess PAMAM. Approximately five to ten DNA molecules
are in one primary complex if the complexes are formed at excess DNA, whereas three
DNA molecules are in one complex if formed at excess polycation.
Another result concerns the charge stoichiometry within one complex. For
excess DNA, Z
+
/Z
À
¼ 0.8 whereas for excess polycation Z
+
/Z
À
¼ 3. It should be
noted that these numbers do not represent the effective charge but the chemical
charge of the complexes, which may include sterically shielded charges in the
interior of the cylindrical brushes and ignores possible reduction of charges by
counterions (Manning condensation, ion pair formation).
In summary, the complexes of DNA with the various cylindrical brush
polycations form primary complexes of constant size as long as no intercomplex
bridging occurs, whereas for PAMAM the complex mass and size increase monotonically with increasing content of the minority component. It should be noted that
all complexes constitute nonequilibrium structures because size and stability
depend significantly on the preparation conditions. For instance, dropping the
minority component into the excess component under stirring, which was applied
for the experiments described above, yields more stable and smaller complexes than
those prepared by rapid mixing in a stopped-flow device. Also, the sequence of
mixing matters. Adding the excess component to the minority component, which is
avoided in the experiments above, seems to be problematic because the titration
0
2 0
4 0
6 0
8 0
1 0 0
0
50
100
150
200
1000
2000
3000
complexed polycation / %
M
w
complex
/ 10
6
g mol
-1
0
2 0
4 0
6 0
8 0
1 0 0
25
50
75
100
125
150
175
200
225
complexed polycation / %
R
g
complex
/ nm
b
0
2 0
4 0
6 0
8 0
1 0 0
25
50
75
100
125
150
a
complexed polycation / %
R
h
complex
/ nm
c
0
2 0
4 0
6 0
8 0
1 0 0
0.00
0.05
0.10
0.15
0.20
0.25
0.30
complexed polycation / %
r
complex
/ g ml
-1
d
Fig. 41 (a) Molar masses, (b) radii of gyration, (c) hydrodynamic radii, and (d) densities of the
complexes as function of the complexed polycation fraction: PVP26 (open black squares), PVP47
(open red circles), PEI (open blue stars), and PAMAM (open inverted green triangles). From [150]
Structure Formation of Polymeric Building Blocks: Complex Polymer Architectures
159
3
), of 0.15 < ρ < 0.25 g/cm
3 for excess DNA and somewhat less compacted for excess polycation, i.e., 0.05 < ρ < 0.1 g/cm
3
. For the
PAMAM dendrimers, the density is even larger, i.e., ρ ¼ 0.3 g/cm
3 for excess DNA
and ρ ¼ 0.2 g/cm
3 for excess PAMAM. Approximately five to ten DNA molecules
are in one primary complex if the complexes are formed at excess DNA, whereas three
DNA molecules are in one complex if formed at excess polycation.
Another result concerns the charge stoichiometry within one complex. For
excess DNA, Z
+
/Z
À
¼ 0.8 whereas for excess polycation Z
+
/Z
À
¼ 3. It should be
noted that these numbers do not represent the effective charge but the chemical
charge of the complexes, which may include sterically shielded charges in the
interior of the cylindrical brushes and ignores possible reduction of charges by
counterions (Manning condensation, ion pair formation).
In summary, the complexes of DNA with the various cylindrical brush
polycations form primary complexes of constant size as long as no intercomplex
bridging occurs, whereas for PAMAM the complex mass and size increase monotonically with increasing content of the minority component. It should be noted that
all complexes constitute nonequilibrium structures because size and stability
depend significantly on the preparation conditions. For instance, dropping the
minority component into the excess component under stirring, which was applied
for the experiments described above, yields more stable and smaller complexes than
those prepared by rapid mixing in a stopped-flow device. Also, the sequence of
mixing matters. Adding the excess component to the minority component, which is
avoided in the experiments above, seems to be problematic because the titration
0
2 0
4 0
6 0
8 0
1 0 0
0
50
100
150
200
1000
2000
3000
complexed polycation / %
M
w
complex
/ 10
6
g mol
-1
0
2 0
4 0
6 0
8 0
1 0 0
25
50
75
100
125
150
175
200
225
complexed polycation / %
R
g
complex
/ nm
b
0
2 0
4 0
6 0
8 0
1 0 0
25
50
75
100
125
150
a
complexed polycation / %
R
h
complex
/ nm
c
0
2 0
4 0
6 0
8 0
1 0 0
0.00
0.05
0.10
0.15
0.20
0.25
0.30
complexed polycation / %
r
complex
/ g ml
-1
d
Fig. 41 (a) Molar masses, (b) radii of gyration, (c) hydrodynamic radii, and (d) densities of the
complexes as function of the complexed polycation fraction: PVP26 (open black squares), PVP47
(open red circles), PEI (open blue stars), and PAMAM (open inverted green triangles). From [150]
Structure Formation of Polymeric Building Blocks: Complex Polymer Architectures
159