

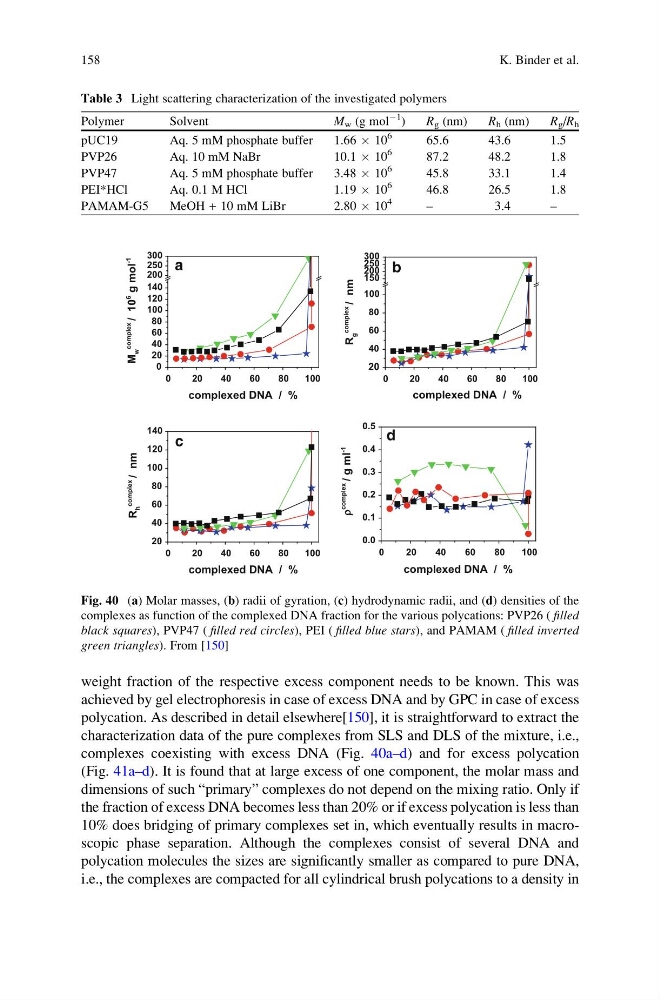
weight fraction of the respective excess component needs to be known. This was
achieved by gel electrophoresis in case of excess DNA and by GPC in case of excess
polycation. As described in detail elsewhere[150], it is straightforward to extract the
characterization data of the pure complexes from SLS and DLS of the mixture, i.e.,
complexes coexisting with excess DNA (Fig. 40a–d) and for excess polycation
(Fig. 41a–d). It is found that at large excess of one component, the molar mass and
dimensions of such “primary” complexes do not depend on the mixing ratio. Only if
the fraction of excess DNA becomes less than 20% or if excess polycation is less than
10% does bridging of primary complexes set in, which eventually results in macroscopic phase separation. Although the complexes consist of several DNA and
polycation molecules the sizes are significantly smaller as compared to pure DNA,
i.e., the complexes are compacted for all cylindrical brush polycations to a density in
Table 3 Light scattering characterization of the investigated polymers
Polymer
Solvent
M w (g mol
À1
)
R g (nm)
R h (nm)
R g /R h
pUC19
Aq. 5 mM phosphate buffer
1.66 Â 10
6
65.6
43.6
1.5
PVP26
Aq. 10 mM NaBr
10.1 Â 10
6
87.2
48.2
1.8
PVP47
Aq. 5 mM phosphate buffer
3.48 Â 10
6
45.8
33.1
1.4
PEI*HCl
Aq. 0.1 M HCl
1.19 Â 10
6
46.8
26.5
1.8
PAMAM-G5
MeOH + 10 mM LiBr
2.80 Â 10
4
–
3.4
–
0
20
40
60
80
100
0
20
40
60
80
100
120
140
200
250
300
complexed DNA / %
M
w
complex
/ 10
6
g mol
-1
a
0
20
40
60
80
100
20
40
60
80
100
150
200
250
300
complexed DNA / %
R
g
complex
/ nm
b
0
20
40
60
80
100
20
40
60
80
100
120
140
complexed DNA / %
R
h
complex
/ nm
c
0
20
40
60
80
100
0.0
0.1
0.2
0.3
0.4
0.5
complexed DNA / %
r
complex
/ g ml
-1
d
Fig. 40 (a) Molar masses, (b) radii of gyration, (c) hydrodynamic radii, and (d) densities of the
complexes as function of the complexed DNA fraction for the various polycations: PVP26 ( filled
black squares), PVP47 ( filled red circles), PEI ( filled blue stars), and PAMAM ( filled inverted
green triangles). From [150]
158
K. Binder et al.
achieved by gel electrophoresis in case of excess DNA and by GPC in case of excess
polycation. As described in detail elsewhere[150], it is straightforward to extract the
characterization data of the pure complexes from SLS and DLS of the mixture, i.e.,
complexes coexisting with excess DNA (Fig. 40a–d) and for excess polycation
(Fig. 41a–d). It is found that at large excess of one component, the molar mass and
dimensions of such “primary” complexes do not depend on the mixing ratio. Only if
the fraction of excess DNA becomes less than 20% or if excess polycation is less than
10% does bridging of primary complexes set in, which eventually results in macroscopic phase separation. Although the complexes consist of several DNA and
polycation molecules the sizes are significantly smaller as compared to pure DNA,
i.e., the complexes are compacted for all cylindrical brush polycations to a density in
Table 3 Light scattering characterization of the investigated polymers
Polymer
Solvent
M w (g mol
À1
)
R g (nm)
R h (nm)
R g /R h
pUC19
Aq. 5 mM phosphate buffer
1.66 Â 10
6
65.6
43.6
1.5
PVP26
Aq. 10 mM NaBr
10.1 Â 10
6
87.2
48.2
1.8
PVP47
Aq. 5 mM phosphate buffer
3.48 Â 10
6
45.8
33.1
1.4
PEI*HCl
Aq. 0.1 M HCl
1.19 Â 10
6
46.8
26.5
1.8
PAMAM-G5
MeOH + 10 mM LiBr
2.80 Â 10
4
–
3.4
–
0
20
40
60
80
100
0
20
40
60
80
100
120
140
200
250
300
complexed DNA / %
M
w
complex
/ 10
6
g mol
-1
a
0
20
40
60
80
100
20
40
60
80
100
150
200
250
300
complexed DNA / %
R
g
complex
/ nm
b
0
20
40
60
80
100
20
40
60
80
100
120
140
complexed DNA / %
R
h
complex
/ nm
c
0
20
40
60
80
100
0.0
0.1
0.2
0.3
0.4
0.5
complexed DNA / %
r
complex
/ g ml
-1
d
Fig. 40 (a) Molar masses, (b) radii of gyration, (c) hydrodynamic radii, and (d) densities of the
complexes as function of the complexed DNA fraction for the various polycations: PVP26 ( filled
black squares), PVP47 ( filled red circles), PEI ( filled blue stars), and PAMAM ( filled inverted
green triangles). From [150]
158
K. Binder et al.