

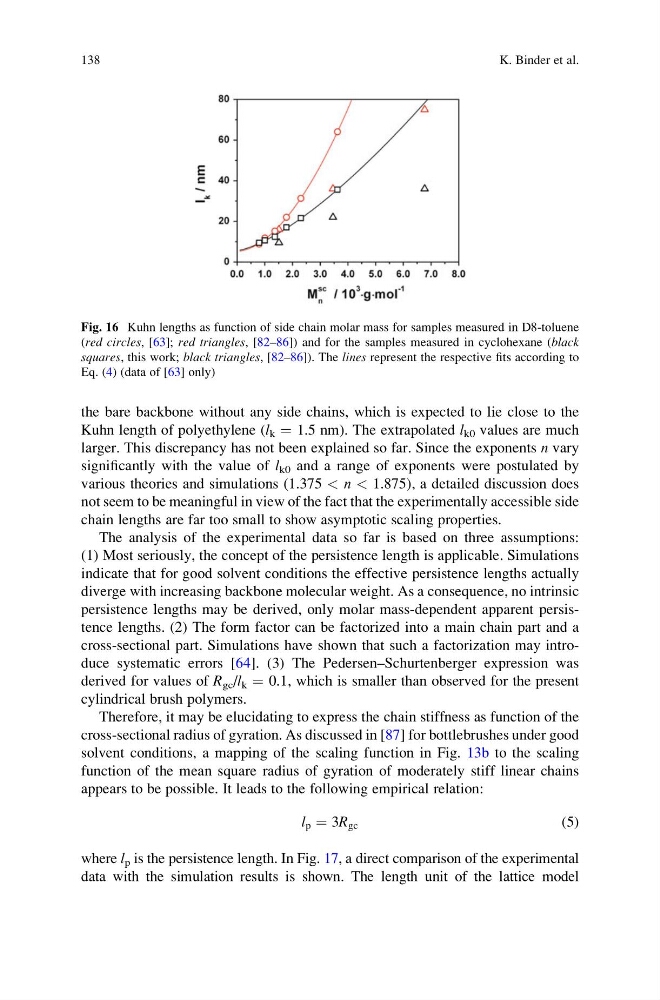
the bare backbone without any side chains, which is expected to lie close to the
Kuhn length of polyethylene (l k ¼ 1.5 nm). The extrapolated l k0 values are much
larger. This discrepancy has not been explained so far. Since the exponents n vary
significantly with the value of l k0 and a range of exponents were postulated by
various theories and simulations (1.375 < n < 1.875), a detailed discussion does
not seem to be meaningful in view of the fact that the experimentally accessible side
chain lengths are far too small to show asymptotic scaling properties.
The analysis of the experimental data so far is based on three assumptions:
(1) Most seriously, the concept of the persistence length is applicable. Simulations
indicate that for good solvent conditions the effective persistence lengths actually
diverge with increasing backbone molecular weight. As a consequence, no intrinsic
persistence lengths may be derived, only molar mass-dependent apparent persistence lengths. (2) The form factor can be factorized into a main chain part and a
cross-sectional part. Simulations have shown that such a factorization may introduce systematic errors [64]. (3) The Pedersen–Schurtenberger expression was
derived for values of R gc /l k ¼ 0.1, which is smaller than observed for the present
cylindrical brush polymers.
Therefore, it may be elucidating to express the chain stiffness as function of the
cross-sectional radius of gyration. As discussed in [87] for bottlebrushes under good
solvent conditions, a mapping of the scaling function in Fig. 13b to the scaling
function of the mean square radius of gyration of moderately stiff linear chains
appears to be possible. It leads to the following empirical relation:
l p ¼ 3R gc
(5)
where l p is the persistence length. In Fig. 17, a direct comparison of the experimental
data with the simulation results is shown. The length unit of the lattice model
Fig. 16 Kuhn lengths as function of side chain molar mass for samples measured in D8-toluene
(red circles, [63]; red triangles, [82–86]) and for the samples measured in cyclohexane (black
squares, this work; black triangles, [82–86]). The lines represent the respective fits according to
Eq. (4) (data of [63] only)
138
K. Binder et al.
Kuhn length of polyethylene (l k ¼ 1.5 nm). The extrapolated l k0 values are much
larger. This discrepancy has not been explained so far. Since the exponents n vary
significantly with the value of l k0 and a range of exponents were postulated by
various theories and simulations (1.375 < n < 1.875), a detailed discussion does
not seem to be meaningful in view of the fact that the experimentally accessible side
chain lengths are far too small to show asymptotic scaling properties.
The analysis of the experimental data so far is based on three assumptions:
(1) Most seriously, the concept of the persistence length is applicable. Simulations
indicate that for good solvent conditions the effective persistence lengths actually
diverge with increasing backbone molecular weight. As a consequence, no intrinsic
persistence lengths may be derived, only molar mass-dependent apparent persistence lengths. (2) The form factor can be factorized into a main chain part and a
cross-sectional part. Simulations have shown that such a factorization may introduce systematic errors [64]. (3) The Pedersen–Schurtenberger expression was
derived for values of R gc /l k ¼ 0.1, which is smaller than observed for the present
cylindrical brush polymers.
Therefore, it may be elucidating to express the chain stiffness as function of the
cross-sectional radius of gyration. As discussed in [87] for bottlebrushes under good
solvent conditions, a mapping of the scaling function in Fig. 13b to the scaling
function of the mean square radius of gyration of moderately stiff linear chains
appears to be possible. It leads to the following empirical relation:
l p ¼ 3R gc
(5)
where l p is the persistence length. In Fig. 17, a direct comparison of the experimental
data with the simulation results is shown. The length unit of the lattice model
Fig. 16 Kuhn lengths as function of side chain molar mass for samples measured in D8-toluene
(red circles, [63]; red triangles, [82–86]) and for the samples measured in cyclohexane (black
squares, this work; black triangles, [82–86]). The lines represent the respective fits according to
Eq. (4) (data of [63] only)
138
K. Binder et al.