

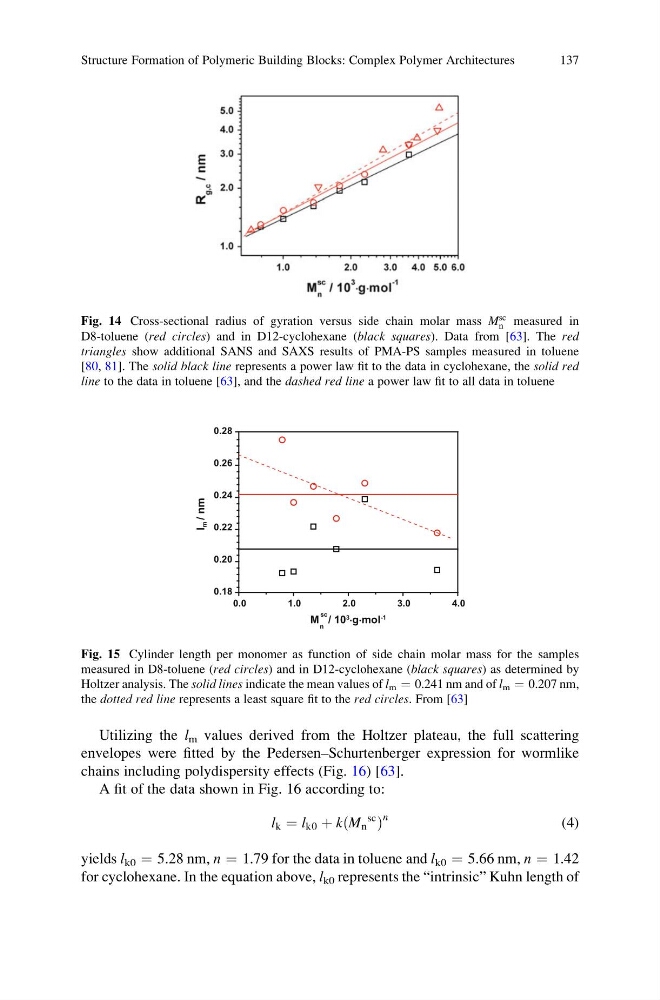
Utilizing the l m values derived from the Holtzer plateau, the full scattering
envelopes were fitted by the Pedersen–Schurtenberger expression for wormlike
chains including polydispersity effects (Fig. 16) [63].
A fit of the data shown in Fig. 16 according to:
l k ¼ l k0 þ k M n
sc
ð
Þ
n
(4)
yields l k0 ¼ 5.28 nm, n ¼ 1.79 for the data in toluene and l k0 ¼ 5.66 nm, n ¼ 1.42
for cyclohexane. In the equation above, l k0 represents the “intrinsic” Kuhn length of
0.0
1.0
2.0
3.0
4.0
0.18
0.20
0.22
0.24
0.26
0.28
l
m / nm
M / 10
3 ×g×mol
-1
sc
n
Fig. 15 Cylinder length per monomer as function of side chain molar mass for the samples
measured in D8-toluene (red circles) and in D12-cyclohexane (black squares) as determined by
Holtzer analysis. The solid lines indicate the mean values of l m ¼ 0.241 nm and of l m ¼ 0.207 nm,
the dotted red line represents a least square fit to the red circles. From [63]
Fig. 14 Cross-sectional radius of gyration versus side chain molar mass M
sc
n measured in
D8-toluene (red circles) and in D12-cyclohexane (black squares). Data from [63]. The red
triangles show additional SANS and SAXS results of PMA-PS samples measured in toluene
[80, 81]. The solid black line represents a power law fit to the data in cyclohexane, the solid red
line to the data in toluene [63], and the dashed red line a power law fit to all data in toluene
Structure Formation of Polymeric Building Blocks: Complex Polymer Architectures
137
envelopes were fitted by the Pedersen–Schurtenberger expression for wormlike
chains including polydispersity effects (Fig. 16) [63].
A fit of the data shown in Fig. 16 according to:
l k ¼ l k0 þ k M n
sc
ð
Þ
n
(4)
yields l k0 ¼ 5.28 nm, n ¼ 1.79 for the data in toluene and l k0 ¼ 5.66 nm, n ¼ 1.42
for cyclohexane. In the equation above, l k0 represents the “intrinsic” Kuhn length of
0.0
1.0
2.0
3.0
4.0
0.18
0.20
0.22
0.24
0.26
0.28
l
m / nm
M / 10
3 ×g×mol
-1
sc
n
Fig. 15 Cylinder length per monomer as function of side chain molar mass for the samples
measured in D8-toluene (red circles) and in D12-cyclohexane (black squares) as determined by
Holtzer analysis. The solid lines indicate the mean values of l m ¼ 0.241 nm and of l m ¼ 0.207 nm,
the dotted red line represents a least square fit to the red circles. From [63]
Fig. 14 Cross-sectional radius of gyration versus side chain molar mass M
sc
n measured in
D8-toluene (red circles) and in D12-cyclohexane (black squares). Data from [63]. The red
triangles show additional SANS and SAXS results of PMA-PS samples measured in toluene
[80, 81]. The solid black line represents a power law fit to the data in cyclohexane, the solid red
line to the data in toluene [63], and the dashed red line a power law fit to all data in toluene
Structure Formation of Polymeric Building Blocks: Complex Polymer Architectures
137