

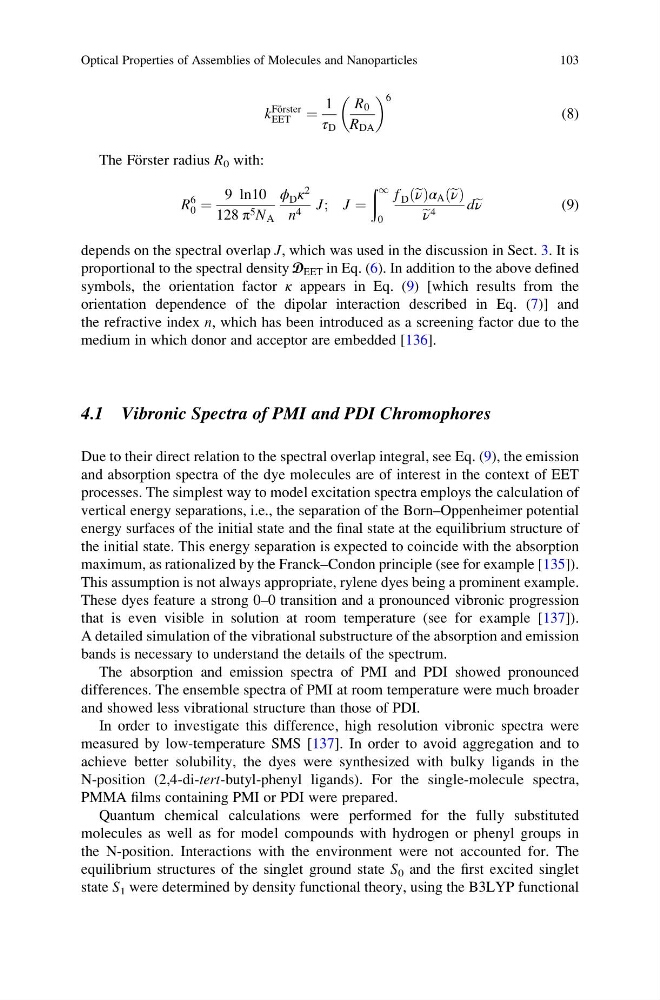
k
Förster
EET ¼
1
τ D
R 0
R DA
6
(8)
The Fo ¨rster radius R 0 with:
R
6
0 ¼
9 ln10
128 π 5 N A
ϕ D κ
2
n 4 J; J ¼
ð 1
0
f D e ν
ð Þα A e ν
ð Þ
e ν 4
de ν
(9)
depends on the spectral overlap J, which was used in the discussion in Sect. 3. It is
proportional to the spectral density D EET in Eq. (6). In addition to the above defined
symbols, the orientation factor κ appears in Eq. (9) [which results from the
orientation dependence of the dipolar interaction described in Eq. (7)] and
the refractive index n, which has been introduced as a screening factor due to the
medium in which donor and acceptor are embedded [136].
4.1 Vibronic Spectra of PMI and PDI Chromophores
Due to their direct relation to the spectral overlap integral, see Eq. (9), the emission
and absorption spectra of the dye molecules are of interest in the context of EET
processes. The simplest way to model excitation spectra employs the calculation of
vertical energy separations, i.e., the separation of the Born–Oppenheimer potential
energy surfaces of the initial state and the final state at the equilibrium structure of
the initial state. This energy separation is expected to coincide with the absorption
maximum, as rationalized by the Franck–Condon principle (see for example [135]).
This assumption is not always appropriate, rylene dyes being a prominent example.
These dyes feature a strong 0–0 transition and a pronounced vibronic progression
that is even visible in solution at room temperature (see for example [137]).
A detailed simulation of the vibrational substructure of the absorption and emission
bands is necessary to understand the details of the spectrum.
The absorption and emission spectra of PMI and PDI showed pronounced
differences. The ensemble spectra of PMI at room temperature were much broader
and showed less vibrational structure than those of PDI.
In order to investigate this difference, high resolution vibronic spectra were
measured by low-temperature SMS [137]. In order to avoid aggregation and to
achieve better solubility, the dyes were synthesized with bulky ligands in the
N-position (2,4-di-tert-butyl-phenyl ligands). For the single-molecule spectra,
PMMA films containing PMI or PDI were prepared.
Quantum chemical calculations were performed for the fully substituted
molecules as well as for model compounds with hydrogen or phenyl groups in
the N-position. Interactions with the environment were not accounted for. The
equilibrium structures of the singlet ground state S 0 and the first excited singlet
state S 1 were determined by density functional theory, using the B3LYP functional
Optical Properties of Assemblies of Molecules and Nanoparticles
103
Förster
EET ¼
1
τ D
R 0
R DA
6
(8)
The Fo ¨rster radius R 0 with:
R
6
0 ¼
9 ln10
128 π 5 N A
ϕ D κ
2
n 4 J; J ¼
ð 1
0
f D e ν
ð Þα A e ν
ð Þ
e ν 4
de ν
(9)
depends on the spectral overlap J, which was used in the discussion in Sect. 3. It is
proportional to the spectral density D EET in Eq. (6). In addition to the above defined
symbols, the orientation factor κ appears in Eq. (9) [which results from the
orientation dependence of the dipolar interaction described in Eq. (7)] and
the refractive index n, which has been introduced as a screening factor due to the
medium in which donor and acceptor are embedded [136].
4.1 Vibronic Spectra of PMI and PDI Chromophores
Due to their direct relation to the spectral overlap integral, see Eq. (9), the emission
and absorption spectra of the dye molecules are of interest in the context of EET
processes. The simplest way to model excitation spectra employs the calculation of
vertical energy separations, i.e., the separation of the Born–Oppenheimer potential
energy surfaces of the initial state and the final state at the equilibrium structure of
the initial state. This energy separation is expected to coincide with the absorption
maximum, as rationalized by the Franck–Condon principle (see for example [135]).
This assumption is not always appropriate, rylene dyes being a prominent example.
These dyes feature a strong 0–0 transition and a pronounced vibronic progression
that is even visible in solution at room temperature (see for example [137]).
A detailed simulation of the vibrational substructure of the absorption and emission
bands is necessary to understand the details of the spectrum.
The absorption and emission spectra of PMI and PDI showed pronounced
differences. The ensemble spectra of PMI at room temperature were much broader
and showed less vibrational structure than those of PDI.
In order to investigate this difference, high resolution vibronic spectra were
measured by low-temperature SMS [137]. In order to avoid aggregation and to
achieve better solubility, the dyes were synthesized with bulky ligands in the
N-position (2,4-di-tert-butyl-phenyl ligands). For the single-molecule spectra,
PMMA films containing PMI or PDI were prepared.
Quantum chemical calculations were performed for the fully substituted
molecules as well as for model compounds with hydrogen or phenyl groups in
the N-position. Interactions with the environment were not accounted for. The
equilibrium structures of the singlet ground state S 0 and the first excited singlet
state S 1 were determined by density functional theory, using the B3LYP functional
Optical Properties of Assemblies of Molecules and Nanoparticles
103