

[138] and the SVP [139] and TZVP [140] basis sets. In addition, wavefunction
methods with second-order treatment of electron correlation effects were used,
specifically MP2 (Møller–Plesset perturbation theory to second order) for the
ground state and ADC(2) (algebraic-diagrammatic construction to second order)
for the excited state [141, 142]. SVP basis sets were used in these cases.
The dipole transition moment is rather large for both PMI and PDI (8 and
9 Debye units, respectively) and does not change significantly upon distortion of
the molecule from the S 0 to the S 1 structure. Hence, the Franck–Condon approximation is appropriate for calculating the vibrational substructure of the absorption
and emission bands.
To this end, harmonic vibrational frequencies for both S 0 and S 1 states were
determined using density functional theory at the B3LYP level and SVP basis sets.
The Franck–Condon factors were determined taking full account of mode mixing
effects (Dushinsky rotation) [143].
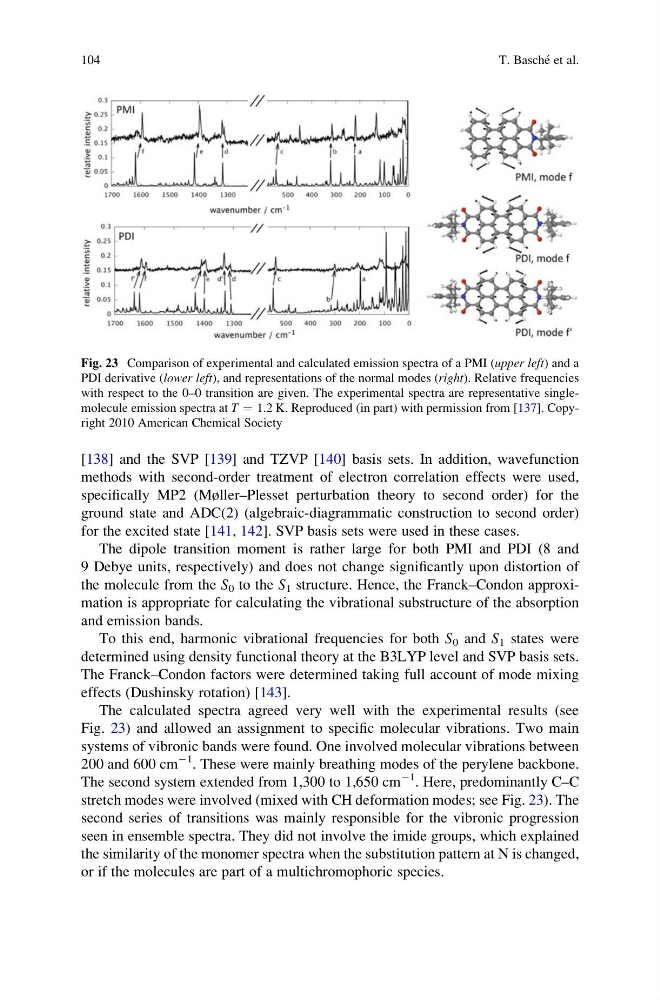
The calculated spectra agreed very well with the experimental results (see
Fig. 23) and allowed an assignment to specific molecular vibrations. Two main
systems of vibronic bands were found. One involved molecular vibrations between
200 and 600 cm
À1 . These were mainly breathing modes of the perylene backbone.
The second system extended from 1,300 to 1,650 cm
À1 . Here, predominantly C–C
stretch modes were involved (mixed with CH deformation modes; see Fig. 23). The
second series of transitions was mainly responsible for the vibronic progression
seen in ensemble spectra. They did not involve the imide groups, which explained
the similarity of the monomer spectra when the substitution pattern at N is changed,
or if the molecules are part of a multichromophoric species.
Fig. 23 Comparison of experimental and calculated emission spectra of a PMI (upper left) and a
PDI derivative (lower left), and representations of the normal modes (right). Relative frequencies
with respect to the 0–0 transition are given. The experimental spectra are representative singlemolecule emission spectra at T ¼ 1.2 K. Reproduced (in part) with permission from [137]. Copyright 2010 American Chemical Society
104
T. Basche ´ et al.
methods with second-order treatment of electron correlation effects were used,
specifically MP2 (Møller–Plesset perturbation theory to second order) for the
ground state and ADC(2) (algebraic-diagrammatic construction to second order)
for the excited state [141, 142]. SVP basis sets were used in these cases.
The dipole transition moment is rather large for both PMI and PDI (8 and
9 Debye units, respectively) and does not change significantly upon distortion of
the molecule from the S 0 to the S 1 structure. Hence, the Franck–Condon approximation is appropriate for calculating the vibrational substructure of the absorption
and emission bands.
To this end, harmonic vibrational frequencies for both S 0 and S 1 states were
determined using density functional theory at the B3LYP level and SVP basis sets.
The Franck–Condon factors were determined taking full account of mode mixing
effects (Dushinsky rotation) [143].
The calculated spectra agreed very well with the experimental results (see
Fig. 23) and allowed an assignment to specific molecular vibrations. Two main
systems of vibronic bands were found. One involved molecular vibrations between
200 and 600 cm
À1 . These were mainly breathing modes of the perylene backbone.
The second system extended from 1,300 to 1,650 cm
À1 . Here, predominantly C–C
stretch modes were involved (mixed with CH deformation modes; see Fig. 23). The
second series of transitions was mainly responsible for the vibronic progression
seen in ensemble spectra. They did not involve the imide groups, which explained
the similarity of the monomer spectra when the substitution pattern at N is changed,
or if the molecules are part of a multichromophoric species.
Fig. 23 Comparison of experimental and calculated emission spectra of a PMI (upper left) and a
PDI derivative (lower left), and representations of the normal modes (right). Relative frequencies
with respect to the 0–0 transition are given. The experimental spectra are representative singlemolecule emission spectra at T ¼ 1.2 K. Reproduced (in part) with permission from [137]. Copyright 2010 American Chemical Society
104
T. Basche ´ et al.