

Using the simulation parameters presented by Chodanowski and Stoll [35], (26)
yields the maximum k value 0.35/A ˚ , when we use the Kuhn length l ¼ 7.14 A ˚ . This
value is approximately 40% larger than the above
k s value. The difference is largely
caused by a too-small Kuhn length (persistence length) used in the theoretical
model. The excluded volume interactions and the electrostatic repulsion of the
equally charged monomers lead to a swelling of the polyelectrolyte compared to the
Gaussian chain used in the present calculations. An appropriate persistence length
can partially account for this swelling. By using a Kuhn length twice as long,
we find that the maximum k value is %0.28/A ˚ , which is close to
k s and thus
demonstrates the correct trend.
We finally would like to emphasize that the variational approach of Muthukumar
and colleagues [56, 107] provides a good description of the scaling behavior of
the critical charge density for polyelectrolyte–sphere interactions, whereas the
same approach fails to predict the correct k
2 dependence in the case of adsorption
onto a cylindrical surface in the limit ka ( 1 (see Sect. 4.3).
3.2.2 Conformational Properties of Adsorbed Polyelectrolytes
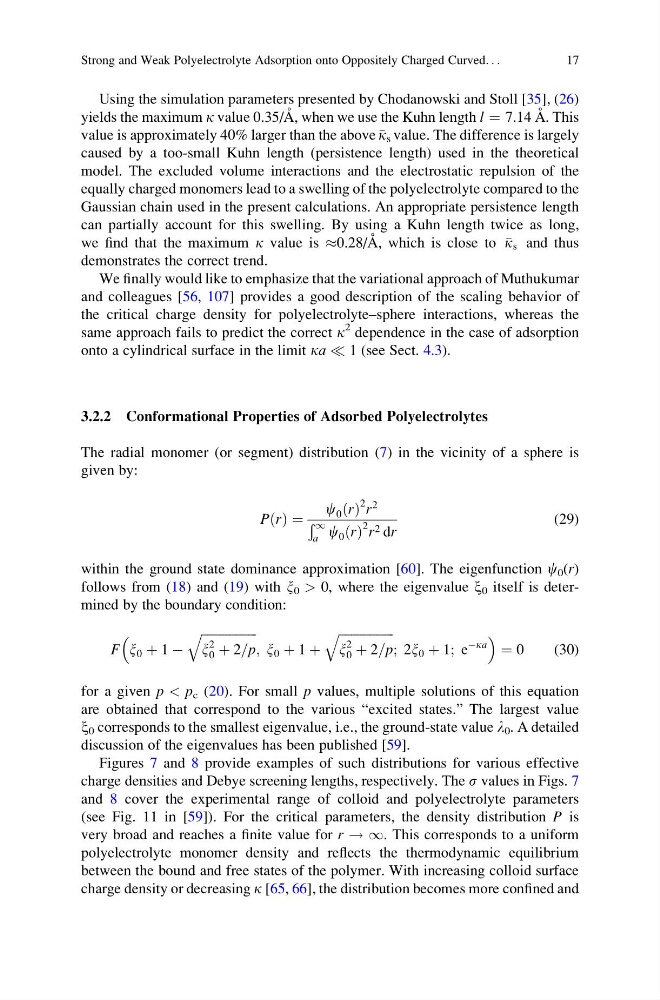
The radial monomer (or segment) distribution (7) in the vicinity of a sphere is
given by:
PðrÞ ¼
c 0 ðrÞ
2 r
2
Ð 1
a c 0 ðrÞ
2 r 2 dr
(29)
within the ground state dominance approximation [60]. The eigenfunction c 0 (r)
follows from (18) and (19) with x 0 > 0, where the eigenvalue x 0 itself is determined by the boundary condition:
F
x 0 þ 1 À
ffiffiffiffiffiffiffiffiffiffiffiffiffiffiffiffiffi ffi
x
2
0 þ 2=p
q
; x 0 þ 1 þ
ffiffiffiffiffiffiffiffiffiffiffiffiffiffiffiffiffi ffi
x
2
0 þ 2=p
q
; 2x 0 þ 1; e
Àka
¼ 0
(30)
for a given p < p c (20). For small p values, multiple solutions of this equation
are obtained that correspond to the various “excited states.” The largest value
x 0 corresponds to the smallest eigenvalue, i.e., the ground-state value l 0 . A detailed
discussion of the eigenvalues has been published [59].
Figures 7 and 8 provide examples of such distributions for various effective
charge densities and Debye screening lengths, respectively. The s values in Figs. 7
and 8 cover the experimental range of colloid and polyelectrolyte parameters
(see Fig. 11 in [59]). For the critical parameters, the density distribution P is
very broad and reaches a finite value for r ! 1. This corresponds to a uniform
polyelectrolyte monomer density and reflects the thermodynamic equilibrium
between the bound and free states of the polymer. With increasing colloid surface
charge density or decreasing k [65, 66], the distribution becomes more confined and
Strong and Weak Polyelectrolyte Adsorption onto Oppositely Charged Curved. . .
17
yields the maximum k value 0.35/A ˚ , when we use the Kuhn length l ¼ 7.14 A ˚ . This
value is approximately 40% larger than the above
k s value. The difference is largely
caused by a too-small Kuhn length (persistence length) used in the theoretical
model. The excluded volume interactions and the electrostatic repulsion of the
equally charged monomers lead to a swelling of the polyelectrolyte compared to the
Gaussian chain used in the present calculations. An appropriate persistence length
can partially account for this swelling. By using a Kuhn length twice as long,
we find that the maximum k value is %0.28/A ˚ , which is close to
k s and thus
demonstrates the correct trend.
We finally would like to emphasize that the variational approach of Muthukumar
and colleagues [56, 107] provides a good description of the scaling behavior of
the critical charge density for polyelectrolyte–sphere interactions, whereas the
same approach fails to predict the correct k
2 dependence in the case of adsorption
onto a cylindrical surface in the limit ka ( 1 (see Sect. 4.3).
3.2.2 Conformational Properties of Adsorbed Polyelectrolytes
The radial monomer (or segment) distribution (7) in the vicinity of a sphere is
given by:
PðrÞ ¼
c 0 ðrÞ
2 r
2
Ð 1
a c 0 ðrÞ
2 r 2 dr
(29)
within the ground state dominance approximation [60]. The eigenfunction c 0 (r)
follows from (18) and (19) with x 0 > 0, where the eigenvalue x 0 itself is determined by the boundary condition:
F
x 0 þ 1 À
ffiffiffiffiffiffiffiffiffiffiffiffiffiffiffiffiffi ffi
x
2
0 þ 2=p
q
; x 0 þ 1 þ
ffiffiffiffiffiffiffiffiffiffiffiffiffiffiffiffiffi ffi
x
2
0 þ 2=p
q
; 2x 0 þ 1; e
Àka
¼ 0
(30)
for a given p < p c (20). For small p values, multiple solutions of this equation
are obtained that correspond to the various “excited states.” The largest value
x 0 corresponds to the smallest eigenvalue, i.e., the ground-state value l 0 . A detailed
discussion of the eigenvalues has been published [59].
Figures 7 and 8 provide examples of such distributions for various effective
charge densities and Debye screening lengths, respectively. The s values in Figs. 7
and 8 cover the experimental range of colloid and polyelectrolyte parameters
(see Fig. 11 in [59]). For the critical parameters, the density distribution P is
very broad and reaches a finite value for r ! 1. This corresponds to a uniform
polyelectrolyte monomer density and reflects the thermodynamic equilibrium
between the bound and free states of the polymer. With increasing colloid surface
charge density or decreasing k [65, 66], the distribution becomes more confined and
Strong and Weak Polyelectrolyte Adsorption onto Oppositely Charged Curved. . .
17