

the intramolecular charge–charge interactions have been taken into account in
simulations by using the Debye–Hu ¨ckel potential as well as excluded-volume
interactions. As a consequence, the simulated systems exhibit significant conformational changes in the polymer when changing the Debye screening length
(see Figs. 1 and 2). By examining the simulation results (particularly Figs. 1 and 3
in [35]) for a chain of N ¼ 100 monomers, we conclude that the polyelectrolyte
molecule exhibits nearly the same conformational behavior for k values close to the
adsorption transition, independent of the colloidal radius (k > $ 0:1/A ˚ ). Thus, a direct
comparison of the theoretical with the simulation results is feasible.
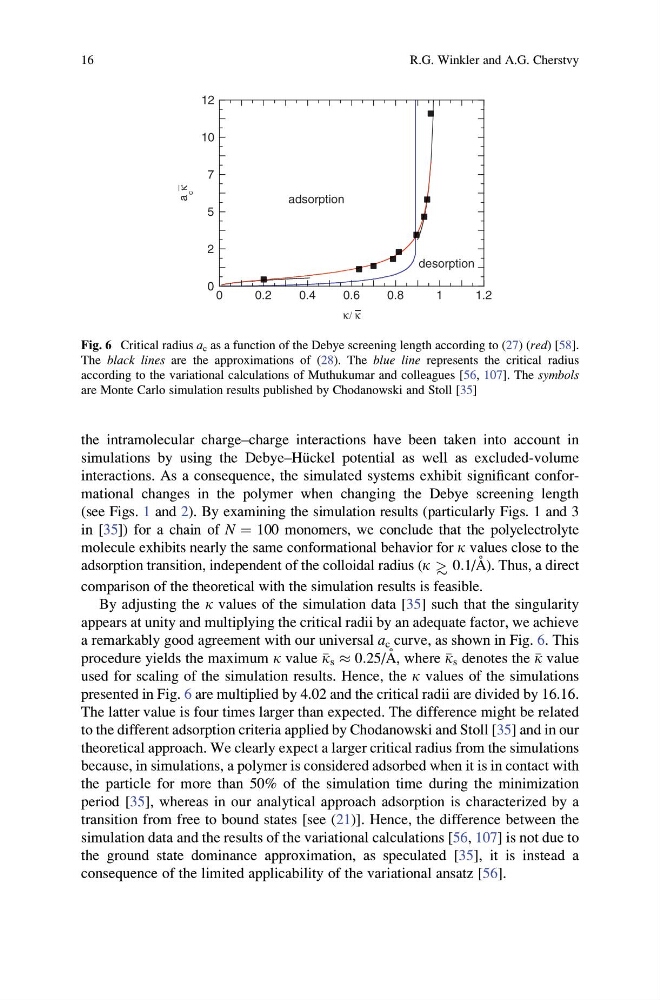
By adjusting the k values of the simulation data [35] such that the singularity
appears at unity and multiplying the critical radii by an adequate factor, we achieve
a remarkably good agreement with our universal a c curve, as shown in Fig. 6. This
procedure yields the maximum k value
k s % 0:25/A ˚ , where
k s denotes the
k value
used for scaling of the simulation results. Hence, the k values of the simulations
presented in Fig. 6 are multiplied by 4.02 and the critical radii are divided by 16.16.
The latter value is four times larger than expected. The difference might be related
to the different adsorption criteria applied by Chodanowski and Stoll [35] and in our
theoretical approach. We clearly expect a larger critical radius from the simulations
because, in simulations, a polymer is considered adsorbed when it is in contact with
the particle for more than 50% of the simulation time during the minimization
period [35], whereas in our analytical approach adsorption is characterized by a
transition from free to bound states [see (21)]. Hence, the difference between the
simulation data and the results of the variational calculations [56, 107] is not due to
the ground state dominance approximation, as speculated [35], it is instead a
consequence of the limited applicability of the variational ansatz [56].
0
2
5
7
10
12
0
0.2
0.4
0.6
0.8
1
1.2
adsorption
desorption
κ / κ
a
c
κ
_
Fig. 6 Critical radius a c as a function of the Debye screening length according to (27) (red) [58].
The black lines are the approximations of (28). The blue line represents the critical radius
according to the variational calculations of Muthukumar and colleagues [56, 107]. The symbols
are Monte Carlo simulation results published by Chodanowski and Stoll [35]
16
R.G. Winkler and A.G. Cherstvy
simulations by using the Debye–Hu ¨ckel potential as well as excluded-volume
interactions. As a consequence, the simulated systems exhibit significant conformational changes in the polymer when changing the Debye screening length
(see Figs. 1 and 2). By examining the simulation results (particularly Figs. 1 and 3
in [35]) for a chain of N ¼ 100 monomers, we conclude that the polyelectrolyte
molecule exhibits nearly the same conformational behavior for k values close to the
adsorption transition, independent of the colloidal radius (k > $ 0:1/A ˚ ). Thus, a direct
comparison of the theoretical with the simulation results is feasible.
By adjusting the k values of the simulation data [35] such that the singularity
appears at unity and multiplying the critical radii by an adequate factor, we achieve
a remarkably good agreement with our universal a c curve, as shown in Fig. 6. This
procedure yields the maximum k value
k s % 0:25/A ˚ , where
k s denotes the
k value
used for scaling of the simulation results. Hence, the k values of the simulations
presented in Fig. 6 are multiplied by 4.02 and the critical radii are divided by 16.16.
The latter value is four times larger than expected. The difference might be related
to the different adsorption criteria applied by Chodanowski and Stoll [35] and in our
theoretical approach. We clearly expect a larger critical radius from the simulations
because, in simulations, a polymer is considered adsorbed when it is in contact with
the particle for more than 50% of the simulation time during the minimization
period [35], whereas in our analytical approach adsorption is characterized by a
transition from free to bound states [see (21)]. Hence, the difference between the
simulation data and the results of the variational calculations [56, 107] is not due to
the ground state dominance approximation, as speculated [35], it is instead a
consequence of the limited applicability of the variational ansatz [56].
0
2
5
7
10
12
0
0.2
0.4
0.6
0.8
1
1.2
adsorption
desorption
κ / κ
a
c
κ
_
Fig. 6 Critical radius a c as a function of the Debye screening length according to (27) (red) [58].
The black lines are the approximations of (28). The blue line represents the critical radius
according to the variational calculations of Muthukumar and colleagues [56, 107]. The symbols
are Monte Carlo simulation results published by Chodanowski and Stoll [35]
16
R.G. Winkler and A.G. Cherstvy